Azure Monitor is a tool, which acts as an umbrella for services that help us gather telemetry data and analyze it. Azure Monitor Captures data in form of Logs and Metrics. Logs contain time-stamped information about changes made to resources. Logs data is mostly in text form. Whereas Metrics are numerical values that describe some aspect of a system at a point in time.
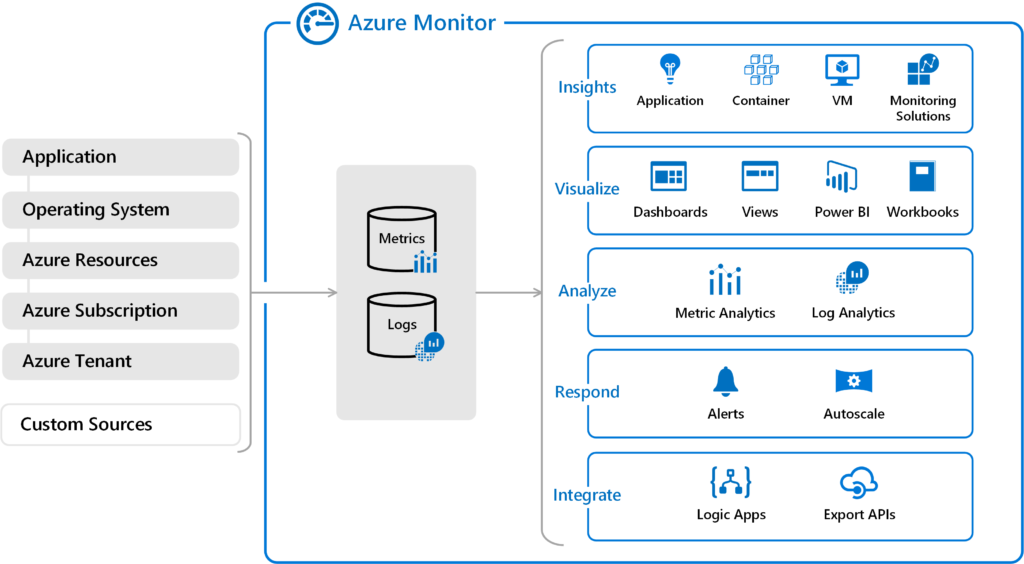
The image above shows how Azure monitor gathers data in form of Logs and Metrics from Applications and other Azure resources. Once data is gathered, Monitor can be used to view and analyze data in the form of tables and graphs. In addition, one can set up an automated response in the form of Alerts or passing the information to Logic Apps or Custom APIs.
You can capture the following data for Azure monitor
Application data: Data that relates to your custom application code.
source: https://docs.microsoft.com/en-us/azure/azure-monitor/overview
Operating system data: Data from the Windows or Linux virtual machines that host your application.
Azure resource data: Data that relates to the operations of an Azure resource, such as a web app or a load balancer.
Azure subscription data: Data that relates to your subscription. It includes data about Azure health and availability.
Azure tenant data: Data about your Azure organization-level services, such as Azure Active Directory.
Here is an example explanation of Azure monitor usage