API Gateway: API Gateway should provide Routing, Aggregating, and SSL Offloading
Offload Non-core responsibilities: Non-core responsibilities including – Security, logging, tracking, etc., should be offloaded to Sidecar or Libraries.
Design for Failure
Fail fast: Patterns like Circuit breaker Pattern, time out Pattern, rate limit Pattern, etc, help applications fail fast
Isolate Failure: A failure should not propagate and impact other services. Bulkhead Pattern helps maintain such a configuration.
Self-healing system: Health checkpoints and scalability settings will help make sure that system is able to manage a server or pod failure.
Monitoring
Health Monitoring: Applications should expose health endpoint (e.g. actuator in Java), which is used by Load balancers to keep a check.
When working with applications for which frontend is available in more than one medium, for example, a desktop and a mobile application. The scenario can be complicated when the Application has different mobile versions for Android and iOS. Also, the APIs might be consumed by third-party services. In short, the same set of APIs has other consumers, which might have different requirements out of them.
One way to solve the problem is that the API being called checks the source of the call and replies with the required data for example for a GET orderdetails call, a mobile call might need just order history listing, whereas a desktop frontend might want to show more information as it can accommodate more on the interface. At the same time, we just want to expose a piece of limited information to a third party caller.
If you will look around you will find many sets of best practices available for creating web applications, microservices, cloud-native applications, and so on. Developers and teams generally tend to share their learnings while they have gone through the process of application development. One needs to understand, learn and figure out what one can use in our application development process.
One such list of best practices, which is very popular among developers and architects is “The twelve-factor app”. https://12factor.net/ There are definitely some interesting points in this, that we should understand and use.
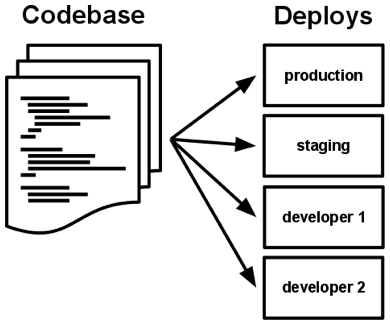
I. Codebase One codebase tracked in revision control, many deploys
Always track your application via the version control system Each microservice should be in its own repository One repository serves multiple deployments e.g. dev, stage, and prod
II. Dependencies Explicitly declare and isolate dependencies
An application has different dependencies to make it work, these can be libraries (jar files), third-party services, databases, etc. You must have seen scenarios where the application is behaving differently on two machines and eventually it is figured out the problem was a different version of a library on the machines.
The idea here is to call out all dependencies explicitly (dependency managers like maven, property files for any third-party dependencies), and isolate them from the main code, so that any developer now can start with a bare minimum setup (say install only Java on the machine) and get started (all dependencies are managed and downloaded separately).
III. Config Store config in the environment
Your application has environment-specific configurations (dev, stage, and prod) like database, caching config, etc.
Keeping configurations with code can have multiple issues
you need to update the code and deploy for any configuration changes
As the access to code will be with most of the developers, it will be difficult to keep control of who can make changes and prone to human errors
To avoid these we will need to keep configurations within the environment.
IV. Backing services Treat backing services as attached resources
Backing services can be databases, storage, message queues, etc. Treating them as resources means that we can replace them easily for example moving from rabitMQ to ActiveMQ
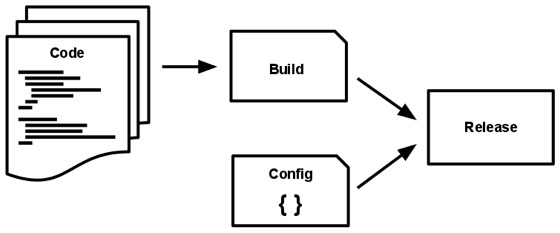
V. Build, release, run Strictly separate build and run stages
Clearly define and separate stages
Build: Results in deployable like war, jar, or ear file that can be deployed to an environment Release: Club build deliverables with environment-specific configuration to create a release Run: A Release is run, e.g. a docker image is deployed on a container.
VI. Processes Execute the app as one or more stateless processes
Look at your application as a stateless process. Imagine the pain maintaining the status for a scalable application (sticky session will hinder true scalability) So make sure to outsource session management
VII. Port binding Export services via port binding
“The twelve-factor app is completely self-contained and does not rely on runtime injection of a webserver into the execution environment to create a web-facing service. The web app exports HTTP as a service by binding to a port, and listening to requests coming in on that port.”
“The process model truly shines when it comes time to scale out. The share-nothing, horizontally partitionable nature of twelve-factor app processes means that adding more concurrency is a simple and reliable operation. “
IX. Disposability Maximize robustness with fast startup and graceful shutdown
“The twelve-factor app’s processes are disposable, meaning they can be started or stopped at a moment’s notice. This facilitates fast elastic scaling, rapid deployment of code or config changes, and robustness of production deploys.”
X. Dev/prod parity Keep development, staging, and production as similar as possible
You might have seen issues, where something that was working and tested on a lower environment, suddenly starts showing some erroneous behavior in production. This can be due to some mismatch in terms of tools/ library versions. To avoid such a situation it is recommended to keep all environments as similar as possible.
XI. Logs Treat logs as event streams
Logs are the lifeline of any application and their importance becomes more with a distributed system (say there is an issue, you need to know where the problem is in a distributed system which might consist of tens of applications). But log handling should not be the responsibility of the code. All logs are streamed out to a specialized system meant to manage logs like Splunk or ELK.
XII. Admin processes Run admin/management tasks as one-off processes
There can be some one-time maintenance tasks like database migration or backup, report generation, a maintenance script, etc. The idea is to keep these tasks independent of the core application and handled separately.
In his post, Martin Fowler talks about Strangler Figs
They seed in the upper branches of a tree and gradually work their way down the tree until they root in the soil. Over many years they grow into fantastic and beautiful shapes, meanwhile strangling and killing the tree that was their host.
This gives a definition to a prevalent development pattern when you are working on moving an existing monolith application to a new microservices-based cloud-native application. You do not make the change in one go, but instead, start small, take a part or functionality from the application, move it to a newer cloud-native microservice, and then remove that piece from the existing application. Step by step the old application is completely replaced by a fresh cloud native microservice-based application.
There will be three phases to such a transition
Transform: Create a parallel application build in microservices, cloud-native design.
Coexist: Incrementally you will implement features and transfer traffic from older monolithic applications to newly built cloud-native applications.
Eliminate: Completely remove the older version and only maintain the new application.
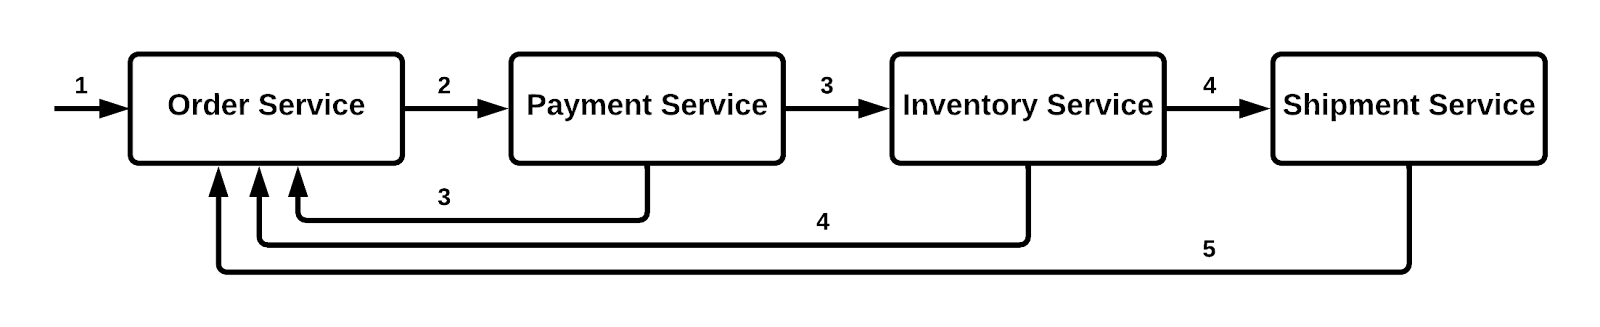
When developing cloud native applications using microservices, there might be time when you want to manage a transaction, where it is set of microservices working with each other to complete the process. For example, lets take a look at example below for placing an order in a e-commerce website.
The Saga design pattern is a way to manage data consistency across microservices in distributed transaction scenarios. A saga is a sequence of transactions that updates each service and publishes a message or event to trigger the next transaction step. If a step fails, the saga executes compensating transactions that counteract the preceding transactions.
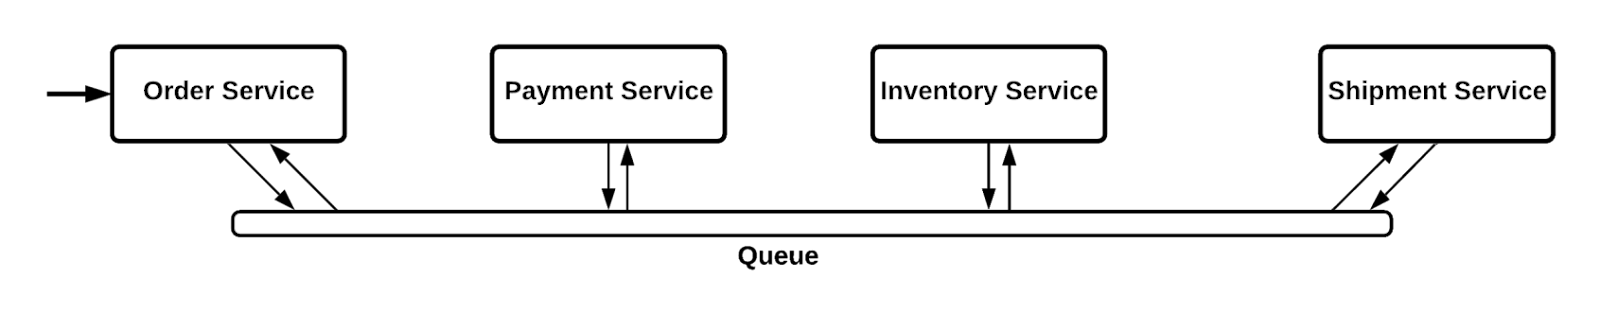
Choreography based SAGA: Event-driven communication across various services. Each service publishes events to the queue, which is listened to by the interested services. The listener services will perform actions based on the data received.
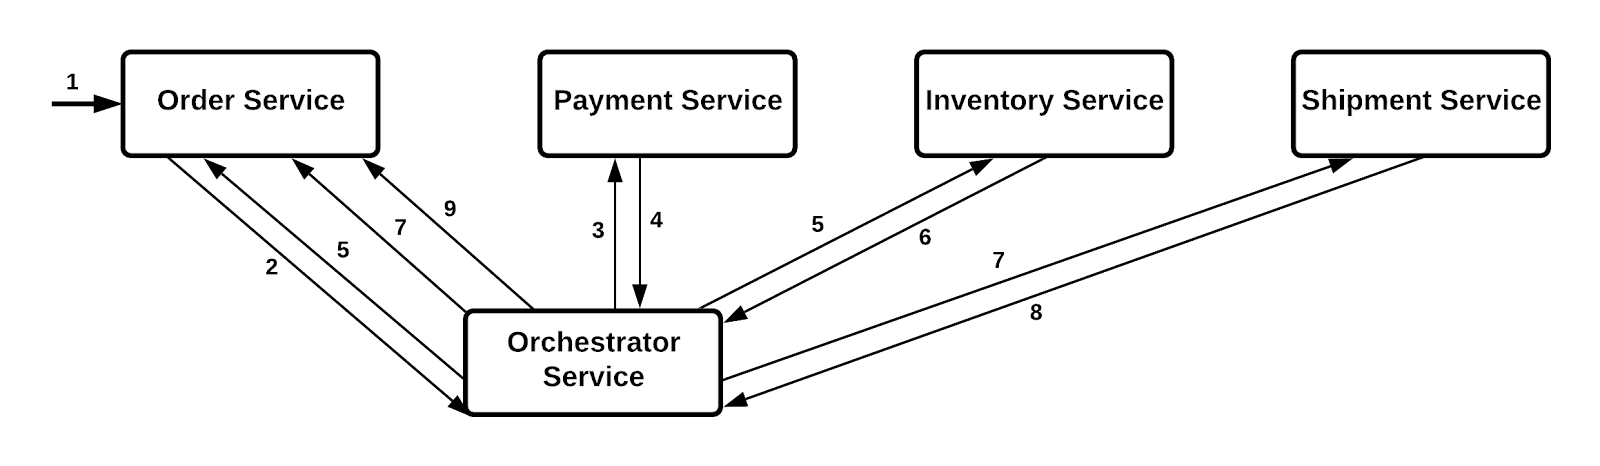
Orchestration based SAGA:
The central role in this type of implementation is played by an orchestrator. The orchestrator service takes control of the overall communication among various services.
Quick Recap: In past posts, we have talked about the basics of monitoring and Golden Signals. We also talked about tools like logs and Metrics which help us create Dashboards and Alerts for monitoring our applications.
In this final post for Monitoring services, I will cover basic areas, that one should consider monitoring when working with a Microservices-based application. One needs to create Dashboards and Alerts around these areas based on application requirements and SLAs.
Service Health: Overall health of the service. Overall health will be a combination of microservices. Ideally, you will put together a single dashboard that provides health details of all critical areas/microservices, so that you can confirm if end-to-end functionality is working fine. For example, the Health of service can be a combination of aspects like CPU load for critical microservices, the number of requests failing (compared to success rate), the response time (based on SLA), etc.
API Health/ Features Health: API Level health, how various APIs are performing. You can create separate dashboards for monitoring APIs/ Microservices.
Infrastructure Health: Another important aspect for monitoring is infrastructure, i.e. CPU, Memory, Network, IO, etc.
Cost: Cloud computing gives us many advantages, but at the same time also brings in additional complexities, managing cost is one of them. Fortunately, most cloud providers give easy ways to manage and monitor costs.
Error and Exceptions: The number of errors and exceptions thrown by your application and code is an important parameter to manage overall service health. For example, after a fresh deployment, if you see an increase in errors or exceptions, you know there is some issue.
Performance: Another important aspect is the performance of critical features. You would like to monitor how your services and APIs are performing and what response time is provided to clients.
Traffic: An increase or decrease in traffic impacts various aspects of the application, including scalability, infrastructure, performance, error rate, security (unexpected traffic might be due to a bot), etc. So it is important to track traffic details.
Success Rate: Success or Error rate helps understand the overall health of the system. A simple ratio would be 2XX to Errored (4XX+5XX) request.
Dependencies – Upstream/ Downstream: In a microservice-based architecture, the service cannot live in isolation. So it is important to track the health and performance of dependencies.
Request Tracing: In microservices-based architecture, where a service calls another service which in turn calls another, and so on, it is difficult to trace error and performance issues. So proper request traceability helps us monitor and debug issues.
Quick Recap: In past posts, we have talked about the basics of monitoring and tools like dashboards, alerts, etc that help us monitor the health of our applications.
Any discussion about monitoring will remain incomplete without talking about Golden signals. We understand that Monitoring an application is a complex task and most importantly different developers and architects can have a different vision when it comes to Monitoring an application. It is challenging to develop a standard set of monitoring practices as every application will have a different need. For some applications, performance would be more important and for others, it might be accuracy or optimized use of infrastructure.
Though coming up with an exact set of monitoring best practices will be difficult. Still, Golden signals are accepted as a general guideline that will help provide overall health of the system. The four golden signals that are generally accepted are
Latency: In simple words, the time it takes to service a request. This gives a measure of performance at a high-level or API level.
Traffic: Request Per second (In total and divided based on request type). An important indicator giving an idea of usage. Performance should be measured in percentile.
Errors: Requests resulting in errors i.e. 5XXs or 4XXs. A ratio of errored requests vs 200s is a good indicator of the success/ error ratio for the application. For example, a new deployment showing a sudden increase in error rate would help in timely rollback and save embarrassment.
Saturation: An indicator of “How full the service is?”. A load test can give you a threshold, and based on that threshold, we can calculate if the current infrastructure can handle X% more traffic.
Quick Recap: In the last post, I discussed the importance of Monitoring and core tools available or monitoring in form of logs, metrics, and traceability.
In this post, I would like to talk more about how we can use the tools we discussed to get more insights into our application.
Dashboards: Well, you have logs, metrics, and traceability in place, but the important next step is to organize the data in a form that makes sense. The answer is dashboards.
A good dashboard is easy to understand and provides you with the point information. You will usually have multiple dashboards, providing information at different levels of detail. For example, a high-level dashboard shows the overall health of the system in terms of CPU usage, Memory usage, Load on the system, overall latency, Error rate, etc. When you see that average latency has gone up, you should be able to drill down to the next level dashboard which can give details based on APIs or services, letting you know which service or services are bringing the global average down. Similarly, if the overall system error rate is increasing, we should be able to drill down to details and find the root cause.
An important thing to highlight here is how many dashboards we need to create. We will try to cover various dashboards in this series, but an important factor is to note that if you have too many dashboards, you will end up not monitoring all, and if you have too few, you will not get all relevant information.
Alerts: An important aspect for monitoring alerts in the event that something out of place has occurred. For example, suddenly your application is seeing too many 5XX errors or CPU usage is increased or traffic has increased. Alerts can again have severity or priority. For example, a 10% increase in error rate is a low priority but if the error rate doubles, it is a different issue. Based on priority one should set channels for alerting, for example, a low-priority alert is sent via email whereas a high-priority alert might mean an automated call to a support person.
Again an important question will be how much alerting is good. If you have too many alerts coming to your inbox, you will start ignoring those. A rule of thumb here is to ask the question- is this alert actionable? Every alert should be associated with action, say an alert says CPU percentage is increasing, add more compute power (VMs or Pods). The action should be automated as much as possible.
Analytics on Monitoring data: Another important aspect is to add analytics to the data captured. It can help one find trends and anomalies. For example, if the traffic data shows every Friday night the load increased on the website, we can plan to add additional compute capacity to handle the traffic.
KPI and SLAs: Finally you will define KPIs or Key Performance Indicators and SLAs or Service Level Agreements on top of your monitoring data. For example, one of the key indicators for the overall health of the system can be latency or response time. Your clients might need an SLA that is 95 percentile (you monitor performance data mostly in percentile) of the requests to an API that will respond in less than 100 milliseconds. Based on the nature of your application these parameters will change.
Microservice-based architecture comes with many advantages over monoliths, especially in areas of scalability, enhance-ability, and maintainability of the application, as instead of a big application we are dealing will smaller pieces that are easier to manage and update.
But every good thing comes with some challenges, and in the case of microservice-based architecture, monitoring of application is one such challenge.
Earlier you were looking at one place for logs, server health, etc for any issues or status. But with such a s distributed system where we have tens or hundreds of microservices, it is difficult to monitor the status of each service individually. For example, say we have a scenario where a service is calling another service which in turn might be calling another service to fulfill a user’s request. Now if a request is failing or responding very slow, which of the service is the culprit? Which logs are to be analyzed?
To solve this issue, we have a set of practices that can help us to build a robust and effective Monitoring Strategy.
Before getting into the Strategy to monitor microservices, let’s take a look at a few core concepts that one needs to be aware of, which are Logs, Metrics, and Traceability.
Logs: Logs are the first place you will look at if you see your application is not behaving in an expected manner. Your application emits logs to publish the current state. Logs are mostly categorized into, Debug, Info, Warning, and Error.
Metrics: Metrics are Time series data published by applications to provide a quick view of an aspect that changes with time depending on external conditions like request traffic. For example, Latency Metrics can show data like if 95% of all calls respond under 300ms.
Traceability: Traceability is very important when it comes to distributed systems with multiple microservices. Say Service A calls Service B which calls C and so on. If you see requests failing or responding slowly, you need to track which services are facing issues. Traceability helps track the journey of a request and monitor it at every step.