In the last three posts, I had talked about three popular off the shelf monitoring tools by cloud service providers, i.e. AWS CloudWatch, Azure Application Insights, and Azure Monitor. A discussion about monitoring cloud-native applications and microservices is incomplete without discussing ELK stack. ELK stack provides end to end functionality from capturing logs, indexing them in a useful manner, and finally visualizing them in a form that makes sense. Three core components that make the ELK stack are Elastic Search, Logstash, and Kibana.
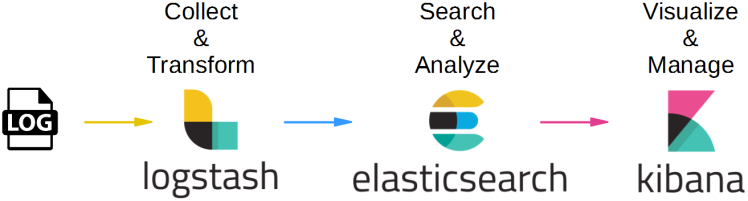
As the image above shows, three tools forming ELK stack work together, where Logstash is responsible for the collection and transformation of logs, ElasticSearch indexes and makes logs searchable, and finally Kiabana helps them visualize in forms of reports which are easy o make sense of.
Let’s take a look at these three components.
ElasticSearch: is a popular search engine implementer. It indexes data and helps in implementing quick searches. It is based on Apache Lucene and provides REST APIs for accessing data. It is highly scalable and reliable, implemented on the No-SQL database.
Logstash: provides connectors for various input sources and platforms, helping in the collection of logs data from different sources. It can collect, parse, and manage a variety of structured and unstructured data.
Kibana: is basically a visualization tool, provides various user-friendly visual options for reporting like graphs, bars, tables, etc. One can create and share dashboards for an easy understanding of data in form of visual reports.
Additional resources:
https://www.youtube.com/watch?v=MRMgd6E9AXE
https://medium.com/devxchange/streaming-spring-boot-application-logs-to-elk-stack-part-1-a68bd7cccaeb
https://www.guru99.com/elk-stack-tutorial.html