
Once your application is deployed to production, monitoring is the only friend that can help you avoid embarrassing situations like a service not responding or an application is running very slow. You would like to make sure that monitoring and alerting systems are in place so that before you start hearing complaints from your end users, you can know about the problem and fix it. You would also like to make sure automated systems are in place to handle such issues.
Amazon CloudWatch is a service provided by AWS which can help us add monitoring for AWS resources.

Let’s try to understand the above design. AWS services publish data to cloud watch in the form of metrics. Metrics here contain time-ordered data for various aspects, like CPU usage. Cloud watch processes the data and is capable of showing that in the form of graphs and bars. One can also set alarms on certain events like CPU usage goes beyond 75%. Based on alarm action can be taken like sending an email notification to admins or autoscale the application by adding an additional server to reduce CPU usage. One can also publish additional application data to CloudWatch for monitoring.
Let’s take a look at how we can create metrics and alerts for EC2 instance. Basic CloudWatch is by default enabled for EC2. You can enable detailed monitoring which will register events every minute, but it is a paid option.
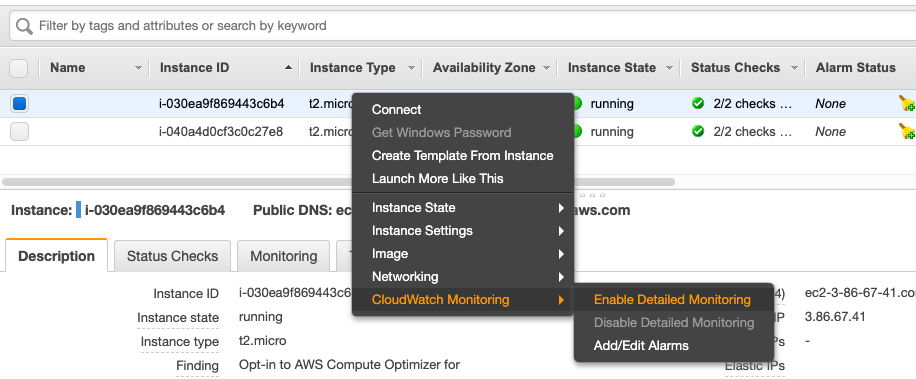
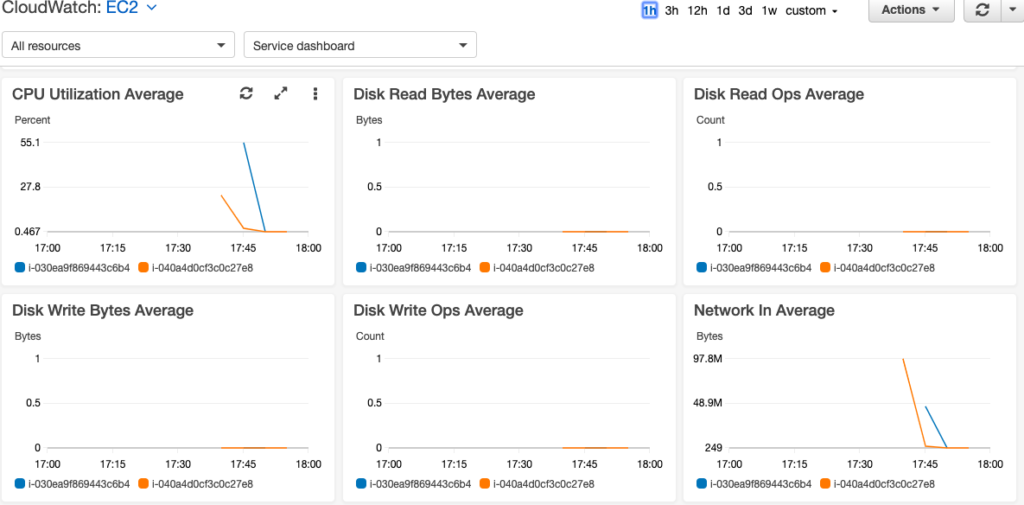
For this example, I will move ahead with basic default monitoring. As I mentioned that default monitoring is enabled by default, so once you go to CloudWatch, select EC2 resources and you will see some default metrics already in place.
As a next step, we will add Alarms for the instances. You can set up alarms at an individual level, scale group level for autoscale, type of instance, and so on. For the sake of this example, I am choosing a metric of average CPU utilization for all my EC2 instances.
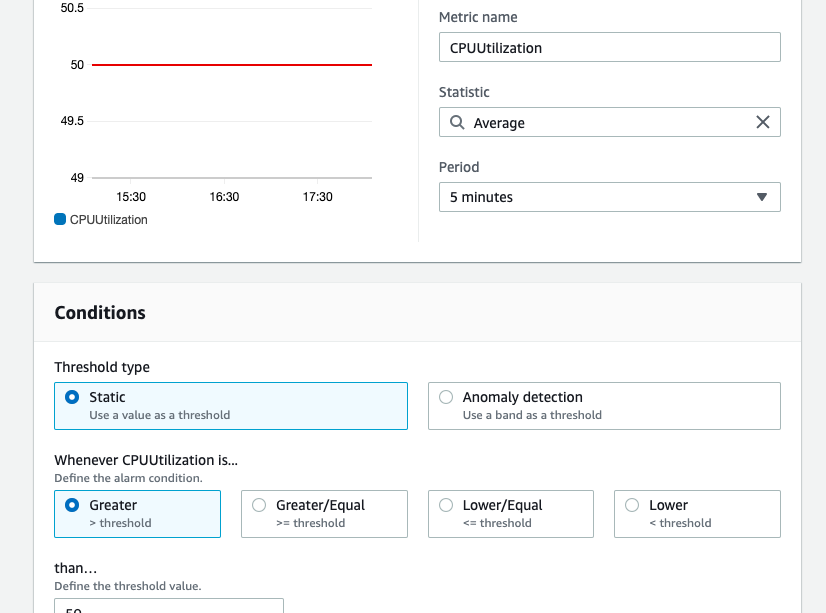
So the alert I am setting says that whenever average CPU utilization for all my instance goes beyond 50% an alarm should be raised. As a result of alarm, I can make the CloudWatch send a message to SNS or Simple Notification Service Queue, from which I can read in some application or serverless function and configure to send email or SMS notifications. One can also set auto-scale options like adding or removing servers or simply restarting an EC2 instance based on the alarm.