There can be cases where we have all the needed data is available, and we need to make decisions such that a given objective is achieved in the best possible manner while satisfying conditions imposed.
To understand the concept let’s take the problem of optimizing resource utilization and maximizing profit, where we have all the details on how much resources are being used by the products. Say in a factory, we are building 2 products, Product A and B. The Factory has 4 units. Product A generates 30000 in profit and manufacturing needs 1 hr in unit 1, 2 hr in unit 2, and 2 hr in unit 3. For product-B, it generates 50000 in profit and its manufacturing needs 2 hr in unit 1, 2 hr in unit 2, and 3 hrs in unit 4. As given constraints, we know that unit 1 can operate 4000 hrs, unit 2 can operate 6000 hrs, unit 3 can operate 5000 hrs and unit 4 can operate 4500 hrs in a month.
To solve this problem, we are going to use the Simplex Linear Programming method. This is available off the shelf in Microsoft Excel, so we will set up the data in an excel sheet.

Simplex LP
Let’s try to understand the data here before moving ahead. We have added data for Product A and B, Profit data for per unit, units manufactures is just a placeholder for now, and then we have given the number of hours spent in each unit by both the products.
Column E2 has total profit, i.e. number of units for product A * per unit profit product A + number of units for product B * per unit profit product B or =SUMPRODUCT(B2:C2, B3:C3)
Column E5 to E8 is also dynamically calculated. For example, E5 has Time spent by product A in unit 1 * units manufactured Product A + Time spent by product B in unit 1 * units manufactured Product B or B5 * B3+ C5 *C3. Similarly, E6,7 and 8 are calculated.
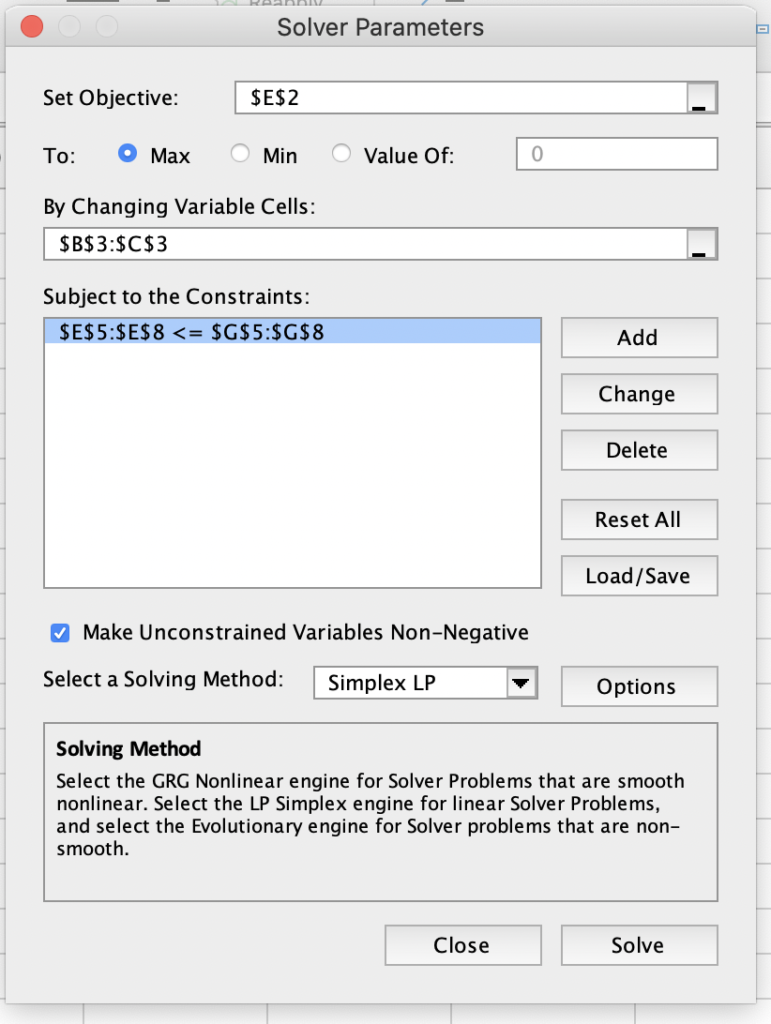
Once we have an excel setup, the next steps are easy. Go to Data -> Solver -> Object (choose column E2 where we calculate total profit) -> For “To”, let the default max be selected as we want to maximize profit -> For Changing variable cells choose B3 and C3 where we have units manufactured for A and B -> Add constraints by selecting Hours available cell reference i.e. from E5 to E8 is <= G5 to G8 (constraints can be added one by one or in one go when the comparison is same i.e. in this case <=) -> Choose Solving method as Simplex LP.

When you click on solve, you will get an optimal solution

The solution says that we should produce 2000 units of product A and 1000 units of product B with a maximized profit of 110000000.
Now there can be situations like due to some operational issue we lost 100 hrs in unit 1 or there is a way we can borrow 100 hours for unit 2 from another factory, what is the impact on our profit. Or say due to change in market dynamics product A can give a profit of 40K instead of 30 K. An valuable tool to look at all the related data is sensitivity analysis. When we clicked solve button on Solver, we are given an option to generate a sensitivity analysis report.

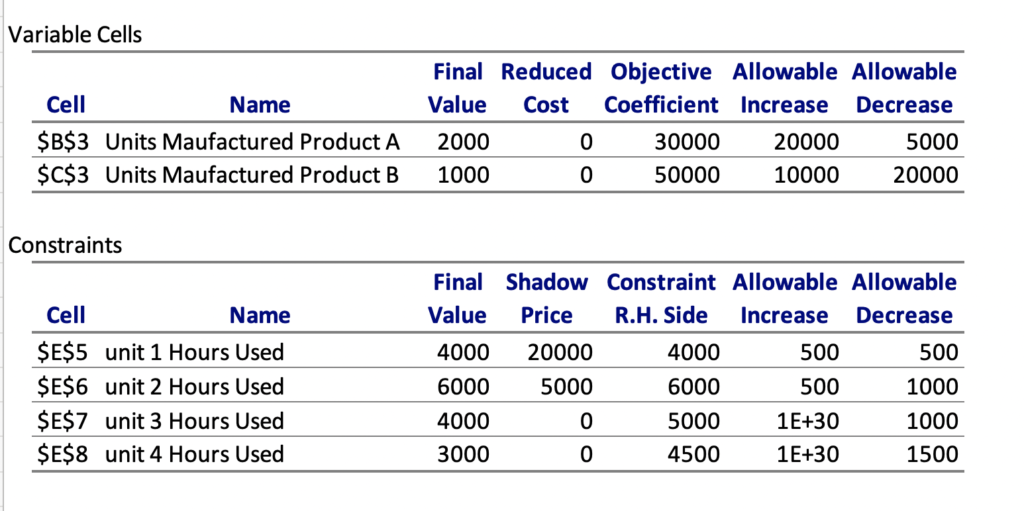
The generated report looks like

The upper 2 rows here talk about 2 products. So coming back to our question, that if instead of 30K, we get a profit of 40K from product A, shall that change my product mix. The report says that there is no impact on product mix for increase by 20 K or decreases by 5K, or in other words, product A profit can range from 25K to 50K and current product mix remains valid. Similarly for Product B, the profit range is 30K to 60K. Any change beyond this will need us to recalculate the analysis.
Coming to Constraint data, shadow price indicates that each hour in the current unit has this much impact. For example, if we can increase unit one capacity by one hour, from 4000 to 4001, we can increase our profit by 20K, so getting extra 100 hours will result in 2000K, and reduction by 100 hours will have the same negative impact on profit. The range of increase and decrease of 500 each says that the calculation is valid till this range, so if we say unit one can get more than 500 hours, we will need to recalculate the values as the current calculation will no more hold good.
