
An important tool for decision-making is sampling and estimation. For any promotional campaign, new product launch strategy, marketing ad campaign, etc. companies need to understand their customer behavior. Sampling and estimation is a strong tool to analyze the customer’s data, for example, say a supermarket company wants to understand how profitable is an online customer vs an offline customer. Rather than going through data for all the customers a random sample is taken and analyzed.
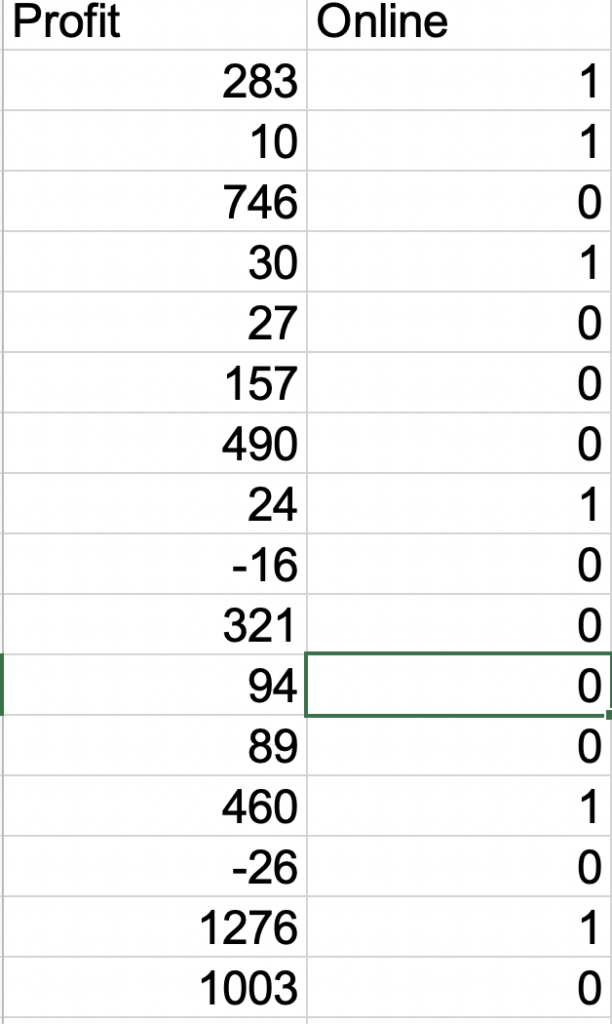
Data Analysis: Let’s say we are able to calculate following data
Sample Size: 14998
Profit for Sample: 1665295
Average: 111.03
Standard Deviation: 275.30
Similarly we can find data for Online vs Offline Customers
Online Customers
Sample Size: 3830
Profit for Sample: 448509
Average: 117.13
Standard Deviation: 283.91
Offline Customers
Sample Size: 11168
Profit for Sample: 1216786
Average: 108.94
Standard Deviation: 272.27
Point Estimates vs Interval Estimates
The above estimate that we have done is a form of a point estimate as we are trying to find an average point and use it as an estimator for the population. For example, we have an average profit estimate for online customers is 117.13. But it is highly unlikely that an online customer’s profit is actually 117.13. So we try to find a range or interval in which the profit is likely to fall. An important aspect of such an analysis is how confident are we with our range. Normally such an analysis is done for confidence levels at 90%, 95% (mostly used), and 99%.
90% Confident Interval (CI) = (sample mean – 1.645* SD/√sample size, sample
mean + 1.645* SD/√sample size)
95% Confident Interval = (sample mean – 1.96* SD/√sample size, sample
mean + 1.96* SD/√sample size)
99% Confident Interval = (sample mean – 2.576* SD/√sample size, sample
mean + 2.576* SD/√sample size)
Let’s solve for online customers CI level 95%
117.13 – 1.96*275.30/√3830 , 117.13 + 1.96*275.30/√3830
108.41, 125.84
Simple Regression Analysis
An important tool for analysis is simple regression, where we try to predict a dependent variable based on the value of the independent variable. The equation would look like
y = mx + c
You might recognize this equation as an equation for a line in the 2D plane. So basically we try to plot all the points on the 2D plane and try to figure out a pattern.
y is the dependent variable
x is the independent variable
m is slope
c is intercept
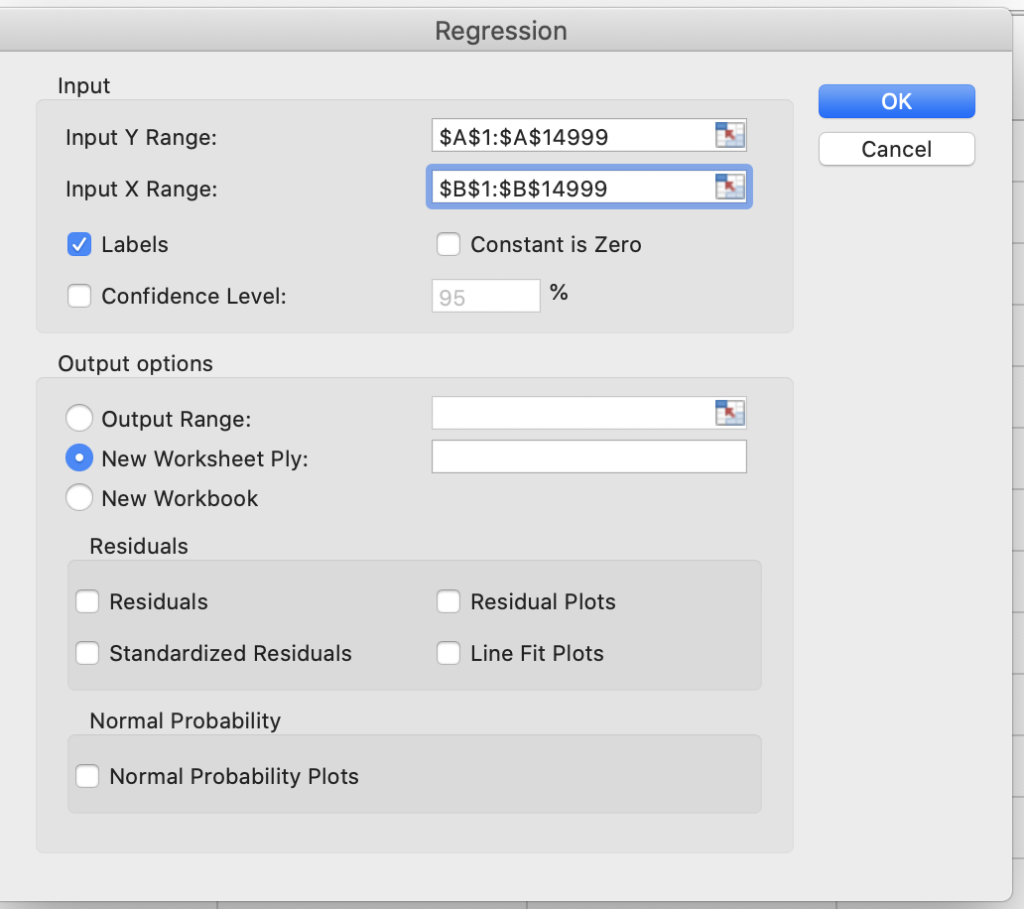
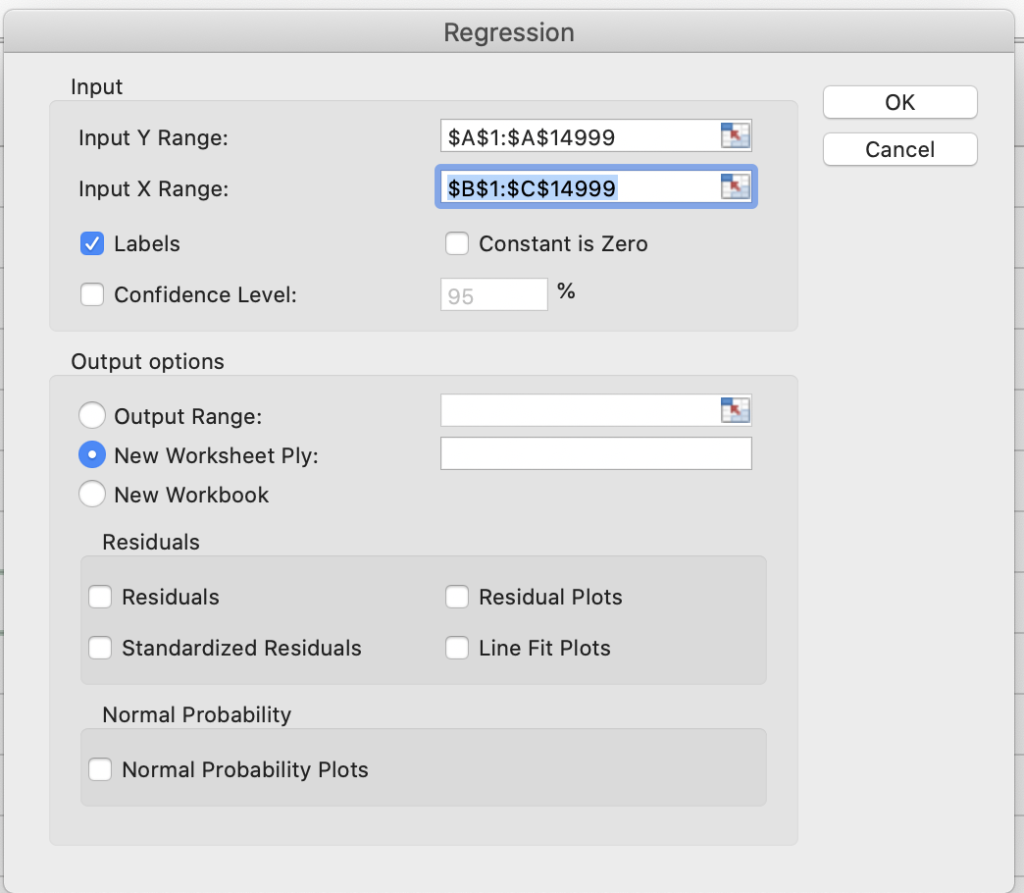
To solve this, Microsoft Excel provide us off the shelf tool for Regression.
Go to Data-> Data Analysis -> Select Regression -> For Y range choose Profit Column -> For X Range choose Online/ Offline Column -> Select Labels checkbox as we have selected header row as well -> Let confidence level default and press OK
Output of Simple regression is
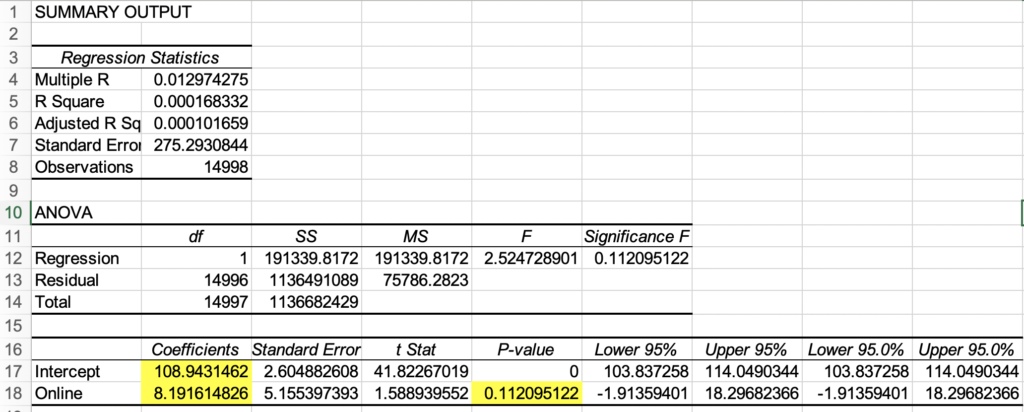
Important values to note here is coefficients, which we can substitute in our equation
y = mx + c
c= 108.94
m = 8.19
x can be online or offline in our case we have values 0 or 1
so for online (x=1) customers, equation resolves to
Profit for online customers = 8.19 * 1 + 108.94 = 117.13
Profit for offline customers = 8.19 * 0 + 108.94 = 108.94
This is ins sync with our earlier calculations.
An important value to note here is P-value. A higher P-value indicates the probability of error in the current analysis. We define a threshold α (alpha), and we keep the p-value below this threshold. I will discuss hypothesis threshold α later, but for now, we can say that a value of 11 is a very high probability of error. So this indicates can we actually associate profit with online or offline parameters. Or are there other parameters that are playing a role?
To understand this, let’s introduce another factor “age” in calculations and solve using multiple regression.
Multiple Regression Analysis
Let’s say we introduce the age data to our excel, and the data is not absolute age but say range id (when you fill a form it gives you ranges 10-18, 19-24, and so on).
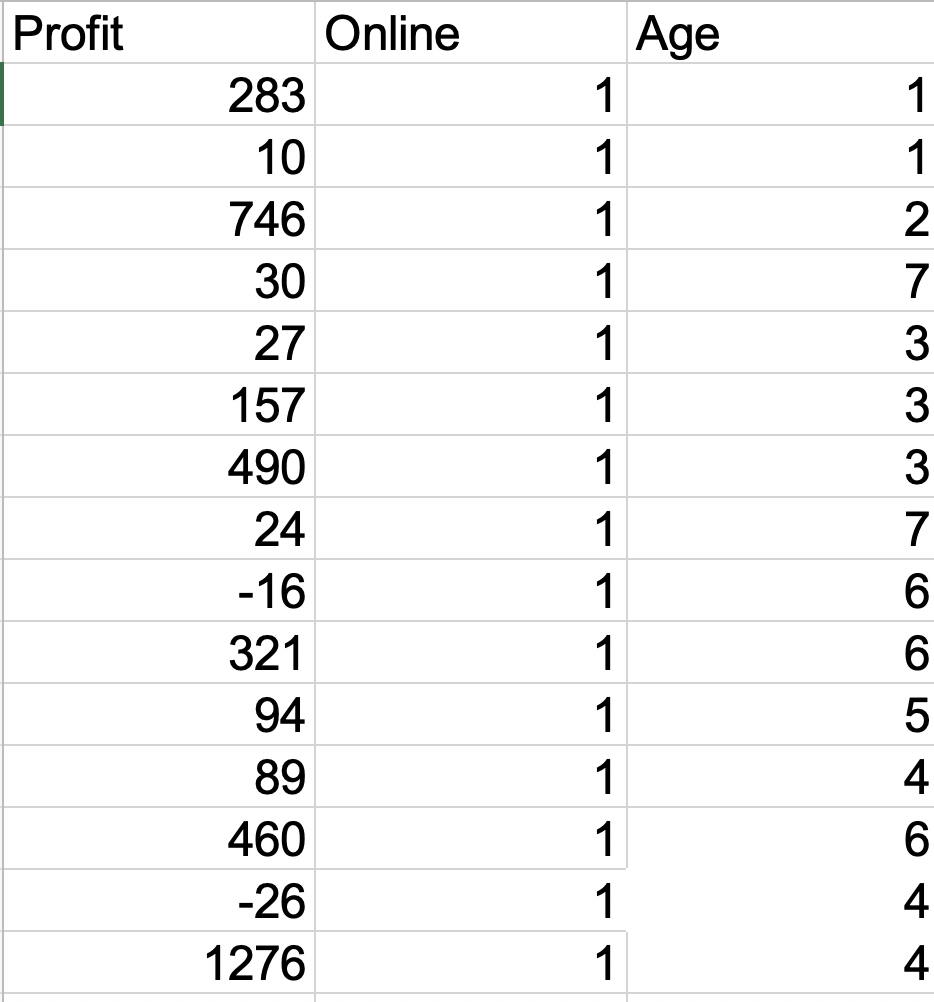
We will repeat the steps to calculate regression, just that this time we will select both online and age column for value of x
Once calculates, we will see values like
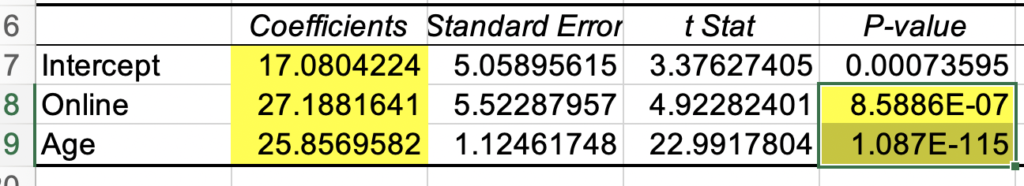
As we can see the P-value this time is very low, we can trust our analysis. We have multiple independent variables, so our equation will be like
y = m1x1 + m2x2 + c
or Profit = 27.181 * online + 25.85 * age + 17.080
We can substitute values and find the Profit, for example, we want to find profit for young people (age group 1)
Profit Online = 27.181 * 1 + 25.85 * 1 + 17.080 =70.03
Profit Offline = 27.181 * 0 + 25.85 * 1 + 17.080 =42.85
We can calculate profit for other age groups as well. We can conclude that both age and mode (online/offline) are playing a role in profit.