We have talked about the basics of decision making and sensitivity analysis. Next, we will look into the usefulness of decision trees in process of decision making.
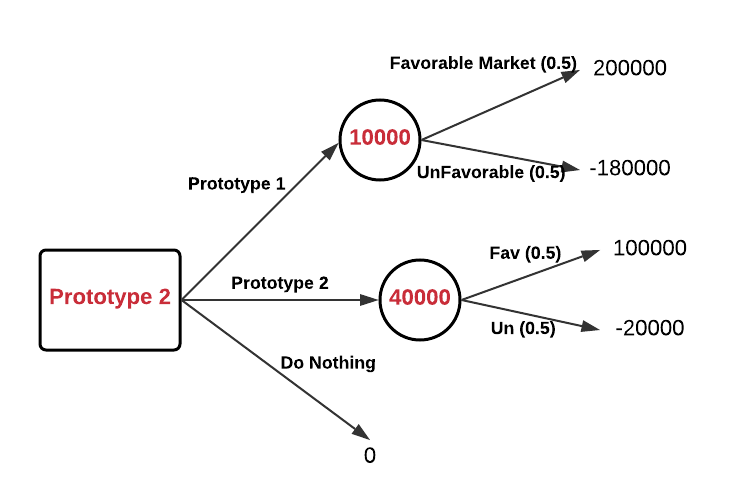
We will go back to our previous example where we are analyzing between 2 product prototypes, and have probabilities and outcomes available. We will represent the data in form of a decision tree and solve the problem.
Before getting into the problem, we need to understand the basic constituents of a decision tree.
Circular nodes: shows various outcomes, for making the decision we calculate the best option based on values of available outcomes and probability
Square Nodes: These are decision nodes, which shows various options available and we need to choose the best
While drawing the decision tree, we go from left to right, but when solving the tree, we go from right to left, calculating one layer at a time. Let’s go back to our example and see the decision tree in action.

We start by creating a tree, mentioning all the options available and their outcomes in case the option is chosen. Then we start solving from right to left and update values for circular – outcome nodes (values in red). We move one step backward and at the decision node, the best option is chosen.
