Cloud Native Application Design – Microservices

I cannot tell you whether the cloud has popularized microservice-based design or is it vice versa, but both go hand in hand. To understand this, let us take a quick trip to the history of the most popular application designs in past few years.

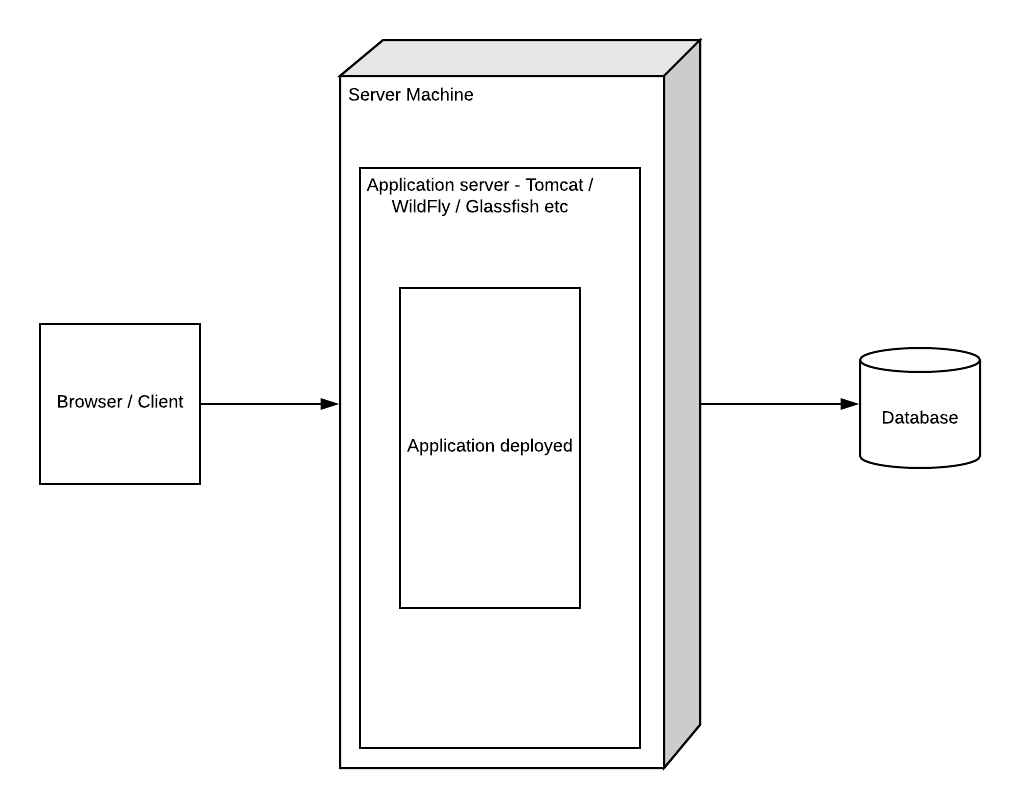
Monolithic design: If you are in the software Industry for more than a decade, you know that there was a time when the whole application was written as one single deployable unit. This does not sound bad if the application itself is small, but as the size of the application grows, it becomes difficult to manage, test, and enhance.

Some of the important challenges with monolith design were – difficulty to update, even a small change needing complete testing and deployment, being stuck with a tech stack, and difficult scaling.

Service-Oriented Architecture: The challenges in Monolithic design paved the way for an architecture where code was distributed in terms of services, hence called Service-Oriented Architecture or SOA. For example, in an e-commerce platform, we will have services for product management, inventory management, shipping management, and so on. This design helped in better organizing the code, but the final application was still compiled into one deployable and deployed to a single application server. Because of this limitation, this inherited most of the challenges from Monolith design.

Microservices: Though SOA inherited challenges from the Monolith era, one important change it brought was to the mindset of the developers and architects. We started looking at the application not as a single piece but as a set of features coming together to solve a common purpose. With the cloud, Infrastructure related limitations were reduced to a great extent, hence giving us the freedom to further divide the application not only at design time but also at run time.

https://microservices.io/patterns/microservices.html

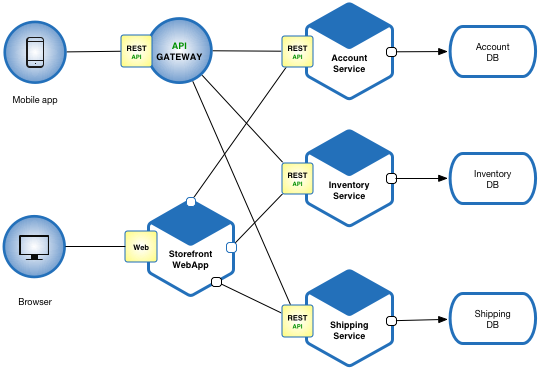
A major change that has come with Microservices is that you are breaking your application into a smaller set of services (hence the term microservice), which can solve one piece of the problem independently. This microservice is designed, developed, tested, deployed, and maintained independently. This also solves most of the problems we faced in Monolith design, because now you can scale, manage, develop (hence use independent tech stacks), and test these microservices independently.

Cloud Native Application Design – Type of Services

At a high level, cloud-provided services can be categorized into the following – Infrastructure as a Service (IaaS), Platform as a Service (PaaS), and Software as a Service (SaaS). Before you design an application for the cloud, it is important to get a basic understanding of these types, to make a call on what application best fits into which kind of service.

Before the cloud, when we owned the infrastructure on which applications were deployed, we were responsible for buying and managing hardware (usually a Server or PC), then deploying Operating Systems, Firewalls, application servers, Databases, and other software for applications to run. Everything needed to be manually handled from the power supply to software patches. This was changed with the introduction of the cloud.

Infrastructure as a Service or IaaS is the basic set of services provided by cloud providers, where you are provided with bare minimum hardware needs. For example, you take a Virtual machine and install OS on that (mostly you will get a VM with pre-installed OS, but you are responsible for managing the patches and upgrades). On top of that, you are responsible for installing and managing any tools and software needed for your applications.

Platform as a Service or PaaS provides a platform on top of which you can deploy your applications. In this case, the only thing you are responsible for is the code or application and data. Amazon Elastic Beanstalk or Azure Web Apps are examples of such services, that help you directly deploy your applications without worrying about underlying hardware or software.

Software as a Service or SaaS, as the name suggests, are services where you get the whole functionality as off the shelf, all you need to do is login and use the software. Any email provider service is a good example, like Gmail. you just need to login and use the service.

https://www.redhat.com/en/topics/cloud-computing/iaas-vs-paas-vs-saas

Azure: Designing Data Flows

Data Flow stages can be defined at a high level as

Ingest -> Transform -> Store -> Analyze.

Data can be processed as Batch Process, which is not a real time processing of data, for example, one collects sales data for whole day and run analytics at the end of the day. Stream processing of data is near real time, where data is processed as it is recieved.

ELT vs ETL: Extract Load and Transform vs Extract Trandorm and Load. As the terms suggests, in ELT, data is loaded first to storage and than transformed. whereas in ETL data is transofrmed first and than loaded. In case of large amount of data, ETL will be difficult as processing large data in real time will be difficult, so ELT might be preffered.

Data Management in Cloud: Azure provides multiple solution for data flow. When choosing a solution one needs to take care of following aspects, Security, Storage Type (IaaS vs PaaS, Blob, File, Database, etc), Performance, Cost, redunancy, availabillity, etc.

Let’s take a look at some important solutions by Azure

Azure Data Lake Storage: Azure Data Lake is a scalable data storage and analytics service. 

Azure Data Factory: Azure Data Factory is Azure’s cloud ETL service for scale-out serverless data integration and data transformation.

Azure Database Services: Azure provides various options for RDBMS and No-SQL database storage.

Azure HDInsight: an open-source analytics service that runs Hadoop, Spark, Kafka and more.

Azure DataBricks: Azure Databricks is a fast, easy and collaborative Apache Spark-based big data analytics service designed for data science and data engineering.

Azure Synapse Analytics: Azure Synapse Analytics is a limitless analytics service that brings together data integration, enterprise data warehousing and big data analytics. It gives you the freedom to query data on your terms, using either serverless or dedicated options—at scale.

Here is how a typical data flow look in Azure

Power BI azure synapse architecture
https://powerbi.tips/2020/12/power-bi-architecture-in-a-data-solution/

Web 3.0 – Potential and Challenges

This post is inspired by the following article on mckinsey.com

https://www.mckinsey.com/industries/financial-services/our-insights/web3-beyond-the-hype

The article discusses Web3.0, where it is right now, what are some of the possible use cases, and what challenges are foreseen. The web has seen an interesting journey in the last couple of decades from Web 1 to 2 to 3.

 While the first incarnation of the web in the 1980s consisted of open protocols on which anyone could build—and from which user data was barely captured—it soon morphed into the second iteration: a more centralized model in which user data, such as identity, transaction history, and credit scores, are captured, aggregated, and often resold. Applications are developed, delivered, and monetized in a proprietary way; all decisions related to their functionality and governance are concentrated in a few hands, and revenues are distributed to management and shareholders.

Web3, the next iteration, potentially upends that power structure with a shift back to users. Open standards and protocols could make their return. The intent is that control is no longer centralized in large platforms and aggregators, but rather is widely distributed through “permissionless” decentralized blockchains and smart contracts.

Web 3.0 is the future, no matter if you like it or not. At this point, it is difficult to predict how things will pan out, but the change will be significant.

The disruptive premise of Web3 is built on three fundamentals: the blockchain that stores all data on asset ownership and the history of conducted transactions; “smart” contracts that represent application logic and can execute specific tasks independently; and digital assets that can represent anything of value and engage with smart contracts to become “programmable.”

Web3 applications and use cases are built on top of three technology fundamentals: blockchain, smart contracts, and digital assets.
https://www.mckinsey.com/industries/financial-services/our-insights/web3-beyond-the-hype

At this point, we are seeing the finance industry as one potential frontrunner in terms of use cases available for Web3.0 and Blockchain. The following image shows how lending is one area where Web3.0 can have an impact.

Web3 could represent a paradigm shift in business models for digital applications.
https://www.mckinsey.com/industries/financial-services/our-insights/web3-beyond-the-hype

The opportunities presented are not without challenges. There needs to be clarity on the responsibility owned by various parties.

The chief challenge is regulatory scrutiny and outlooks. Regulators in many countries are looking to issue new guidance for Web3 that balances the risks and the innovative potential, but the picture remains unsettled. For now, there is a lack of clarity—and jurisdictional consistency—about classifying these assets, services, and governance models. For example, smart contracts are not yet legally enforceable. 

Cloud Native Application Design – Cloud Computing

I introduced Cloud Native Application Design and Cloud Computing in the last post. As a next step, we will discuss cloud computing a little more. Understanding cloud computing is the first step toward generating cloud-native applications.

So what is cloud computing? Cloud computing is a term we use to collectively call services provided by cloud service providers. These services include storage, compute, networking, security, etc. Let me borrow the official definition from Wikipedia.

Cloud computing is the on-demand availability of computer system resources, especially data storage (cloud storage) and computing power, without direct active management by the user. Large clouds often have functions distributed over multiple locations, each location being a data center. Cloud computing relies on sharing of resources to achieve coherence and typically uses a “pay-as-you-go” model, which can help in reducing capital expenses but may also lead to unexpected operating expenses for users.

https://en.wikipedia.org/wiki/Cloud_computing

The definition covers a few important aspects.

On-Demand: You can activate or deactivate the services as per your need. You are renting the services and not buying any hardware. For example, you can activate/rent a Virtual Machine on the cloud, use it, and then kill it (you take compute capacity from the cloud pool and return it back when you are done).

Multiple Types of services: The definition talks about Compute and Storage (these are basic, and one can argue most services are built on these), but if you go to any popular cloud service provider’s portal, you will see a much larger set of services like databases, security services, AI/ ML based, IOT, etc.

Data Centers: Cloud service providers have multiple data centers, spread across various geographical regions in the world, each region has multiple data centers (usually distributed into zones, with one zone having multiple data centers). This kind of setup helps in replicating resources for scalability, availability, and performance.

Shared Resources: As already mentioned, when on the cloud, you do not own resources and share infrastructure with other users (though cloud providers also have an option for separated infrastructure at a higher price). This helps cloud providers manage the resources at scale, hence keeping the prices low.

Pay-as-you-go: Probably one of the most important factors for the popularity of the cloud. You pay for your usage only. Going back to our previous example, you created a VM for X amount of time, so you pay only for that time.

Unexpected Operating Expenses: Though Cloud is popular because it can help reduce overall infrastructure costs, it can also go the other way if you are not careful about managing your resources. For example, unused resources or unused capacity will add to your bills, at the same time, low capability resources will impact services and user experience. So striking the correct balance becomes important and needs expertise, hence adding to operating costs.

Blockchain – Basics

If we look at the word blockchain, it gets simplified to a chain of blocks. A block in the blockchain is a node that contains, data, hash, and previous hash. This previous hash information helps these nodes connect to each other, hence forming the chain.

blockchain is a type of distributed ledger technology (DLT) that consists of growing list of records, called blocks, that are securely linked together using cryptography. Each block contains a cryptographic hash of the previous block, a timestamp, and transaction data

https://en.wikipedia.org/wiki/Blockchain

Blockchain is a shared, immutable ledger that facilitates the process of recording transactions and tracking assets in a business network. 

https://www.ibm.com/in-en/topics/what-is-blockchain

Three terms we are hearing here

Ledger: In simple terms, a ledger is a book of records. In this case, a record is a block. And blocks chained to each other (blockchain) form the ledger.

Distributed: This is where things get interesting, this ledger is not dependent on one machine available in multiple machines, hence distributed in nature.

Immutable: Records or Blocks are immutable. This is because updating a record means corrupting the hash (hence the whole chain is corrupted).

Cloud Native Application Design – Basics

Cloud native application, or cloud native design, or cloud native architecture, or .. well the list is endless, and unless you are living under a rock, you hear these terms almost on daily basis. The critical question here is, do we understand what the term “cloud-native” means? Mostly “cloud-native” is confused with anything that is deployed on the cloud. And nothing can be more wrong.

What is “Cloud-Native”?

Cloud-native architecture and technologies are an approach to designing, constructing, and operating workloads that are built in the cloud and take full advantage of the cloud computing model.

https://learn.microsoft.com/en-us/dotnet/architecture/cloud-native/definition

Cloud native technologies empower organizations to build and run scalable applications in modern, dynamic environments such as public, private, and hybrid clouds. Containers, service meshes, microservices, immutable infrastructure, and declarative APIs exemplify this approach.

https://www.cncf.io/about/who-we-are/

Let me just say, “Cloud Native” means “Built for Cloud”. You start by keeping in mind what Cloud can do for you while designing your application.

Easier said than done. Most of the time, you will design a solution and then try to fit it into the cloud. Another challenge might be your understanding of the cloud. Cloud (or better we should call it cloud computing) itself can be a complex concept. So let us take a moment to demystify it, and let’s start with how industry leaders define it.

What is Cloud-Computing?

Simply put, cloud computing is the delivery of computing services—including servers, storage, databases, networking, software, analytics, and intelligence—over the Internet (“the cloud”) to offer faster innovation, flexible resources, and economies of scale. You typically pay only for cloud services you use, helping lower your operating costs, run your infrastructure more efficiently and scale as your business needs change.

https://azure.microsoft.com/en-in/resources/cloud-computing-dictionary/what-is-cloud-computing/#benefits

Cloud computing is the on-demand delivery of IT resources over the Internet with pay-as-you-go pricing. Instead of buying, owning, and maintaining physical data centers and servers, you can access technology services, such as computing power, storage, and databases, on an as-needed basis from a cloud provider like Amazon Web Services (AWS).

https://aws.amazon.com/what-is-cloud-computing/

In short, Cloud-Computing is a set of services, in the form of compute capabilities, storage, networking, security, etc. that one can use off-the-shelf. As an extension, we can say Cloud-Native design is designing our system keeping the full advantage of these services.

Monitoring Microservices: Part 4

Quick Recap: In past posts, we have talked about the basics of monitoring and Golden Signals. We also talked about tools like logs and Metrics which help us create Dashboards and Alerts for monitoring our applications.

In this final post for Monitoring services, I will cover basic areas, that one should consider monitoring when working with a Microservices-based application. One needs to create Dashboards and Alerts around these areas based on application requirements and SLAs.

Service Health: Overall health of the service. Overall health will be a combination of microservices. Ideally, you will put together a single dashboard that provides health details of all critical areas/microservices, so that you can confirm if end-to-end functionality is working fine. For example, the Health of service can be a combination of aspects like CPU load for critical microservices, the number of requests failing (compared to success rate), the response time (based on SLA), etc.

API Health/ Features Health: API Level health, how various APIs are performing. You can create separate dashboards for monitoring APIs/ Microservices.

Infrastructure Health: Another important aspect for monitoring is infrastructure, i.e. CPU, Memory, Network, IO, etc.

Cost: Cloud computing gives us many advantages, but at the same time also brings in additional complexities, managing cost is one of them. Fortunately, most cloud providers give easy ways to manage and monitor costs.

Error and Exceptions: The number of errors and exceptions thrown by your application and code is an important parameter to manage overall service health. For example, after a fresh deployment, if you see an increase in errors or exceptions, you know there is some issue.

Performance: Another important aspect is the performance of critical features. You would like to monitor how your services and APIs are performing and what response time is provided to clients.

Traffic: An increase or decrease in traffic impacts various aspects of the application, including scalability, infrastructure, performance, error rate, security (unexpected traffic might be due to a bot), etc. So it is important to track traffic details.

Success Rate: Success or Error rate helps understand the overall health of the system. A simple ratio would be 2XX to Errored (4XX+5XX) request.

Dependencies – Upstream/ Downstream: In a microservice-based architecture, the service cannot live in isolation. So it is important to track the health and performance of dependencies.

Request Tracing: In microservices-based architecture, where a service calls another service which in turn calls another, and so on, it is difficult to trace error and performance issues. So proper request traceability helps us monitor and debug issues.

Monitoring Microservices: Part 3

Quick Recap: In past posts, we have talked about the basics of monitoring and tools like dashboards, alerts, etc that help us monitor the health of our applications.

Any discussion about monitoring will remain incomplete without talking about Golden signals. We understand that Monitoring an application is a complex task and most importantly different developers and architects can have a different vision when it comes to Monitoring an application. It is challenging to develop a standard set of monitoring practices as every application will have a different need. For some applications, performance would be more important and for others, it might be accuracy or optimized use of infrastructure.

Though coming up with an exact set of monitoring best practices will be difficult. Still, Golden signals are accepted as a general guideline that will help provide overall health of the system. The four golden signals that are generally accepted are

Latency: In simple words, the time it takes to service a request. This gives a measure of performance at a high-level or API level.

Traffic: Request Per second (In total and divided based on request type). An important indicator giving an idea of usage. Performance should be measured in percentile.

Errors: Requests resulting in errors i.e. 5XXs or 4XXs. A ratio of errored requests vs 200s is a good indicator of the success/ error ratio for the application. For example, a new deployment showing a sudden increase in error rate would help in timely rollback and save embarrassment.

Saturation: An indicator of “How full the service is?”. A load test can give you a threshold, and based on that threshold, we can calculate if the current infrastructure can handle X% more traffic.

https://www.ibm.com/garage/method/practices/manage/golden-signals/

https://sre.google/sre-book/monitoring-distributed-systems/#xref_monitoring_golden-signals

Monitoring Microservices: Part 2

Quick Recap: In the last post, I discussed the importance of Monitoring and core tools available or monitoring in form of logs, metrics, and traceability.

In this post, I would like to talk more about how we can use the tools we discussed to get more insights into our application.

Dashboards: Well, you have logs, metrics, and traceability in place, but the important next step is to organize the data in a form that makes sense. The answer is dashboards.

https://blog.appoptics.com/the-four-golden-signals-for-monitoring-distributed-systems/

A good dashboard is easy to understand and provides you with the point information. You will usually have multiple dashboards, providing information at different levels of detail. For example, a high-level dashboard shows the overall health of the system in terms of CPU usage, Memory usage, Load on the system, overall latency, Error rate, etc. When you see that average latency has gone up, you should be able to drill down to the next level dashboard which can give details based on APIs or services, letting you know which service or services are bringing the global average down. Similarly, if the overall system error rate is increasing, we should be able to drill down to details and find the root cause.

An important thing to highlight here is how many dashboards we need to create. We will try to cover various dashboards in this series, but an important factor is to note that if you have too many dashboards, you will end up not monitoring all, and if you have too few, you will not get all relevant information.

Alerts: An important aspect for monitoring alerts in the event that something out of place has occurred. For example, suddenly your application is seeing too many 5XX errors or CPU usage is increased or traffic has increased. Alerts can again have severity or priority. For example, a 10% increase in error rate is a low priority but if the error rate doubles, it is a different issue. Based on priority one should set channels for alerting, for example, a low-priority alert is sent via email whereas a high-priority alert might mean an automated call to a support person.

Again an important question will be how much alerting is good. If you have too many alerts coming to your inbox, you will start ignoring those. A rule of thumb here is to ask the question- is this alert actionable? Every alert should be associated with action, say an alert says CPU percentage is increasing, add more compute power (VMs or Pods). The action should be automated as much as possible.

Analytics on Monitoring data: Another important aspect is to add analytics to the data captured. It can help one find trends and anomalies. For example, if the traffic data shows every Friday night the load increased on the website, we can plan to add additional compute capacity to handle the traffic.

KPI and SLAs: Finally you will define KPIs or Key Performance Indicators and SLAs or Service Level Agreements on top of your monitoring data. For example, one of the key indicators for the overall health of the system can be latency or response time. Your clients might need an SLA that is 95 percentile (you monitor performance data mostly in percentile) of the requests to an API that will respond in less than 100 milliseconds. Based on the nature of your application these parameters will change.