Off late I have been working on and exploring some API proxy tools. I have seen the terms API proxy and API gateway being used interchangeably most of the time, and probably somewhere both try to solve similar problems, with a slight change.
When we talk about API proxy, we are talking about reverse proxy functionality where we can expose our existing APIs to the outside world through a proxy server. So the user applications are not directly talking to your APIs but interacting through the proxy. The idea here is simple, that you need not let everyone know internal details about how and where your servers are deployed. API proxy can also work as a load balancer for API deployed on multiple servers. It can provide additional features like monitoring, quota implementation, rate limiting for your APIs.
An API gateway does all that and provides add-on features like orchestration, for example, when the client hits “/products” API, the gateway might talk to multiple services and collaborate the data before sending back. Additionally, it can provide Mediation like converting request or response formats. It can also help expose a SOAP service as a set of REST endpoints and vice versa. It can provide sophisticated features like handling DDOS attacks.
There is no hard boundary line between API Proxy and API Gateway, and we will find the terms being used interchangeably. Features too, at a certain level, are overlapping. So at the end of the day just look for the tool that fulfils your requirements.
With the popularity of microservices-based design, we are ending up with tens and hundreds of APIs being created for our applications. Apigee is a platform for developing and managing APIs. It provides a proxy layer for our backend APIs. We can rely on this proxy layer to provide us with a lot of features like security, rate limiting, quotas implementation, analytics, monitoring, and so on.
The core features provided by Apigee are
Design: One can create APIs, and configure or code policies as steps in API flows. Policies can help implement features like rate limiting, quota implementation, payload transformation, and so on.
Security: One can enforce security best practices and governance policies. Implement features like authentication, encryption, SSL offloading, etc at the proxy layer.
Publish: We can provide reference documentation and manage the audience for the API from the portal.
Analyze: Drill down usage data, investigate the spikes and trace calls in real time.
Monitor: Ensure API availability and provide a seamless experience to the APIs.
Hands on example
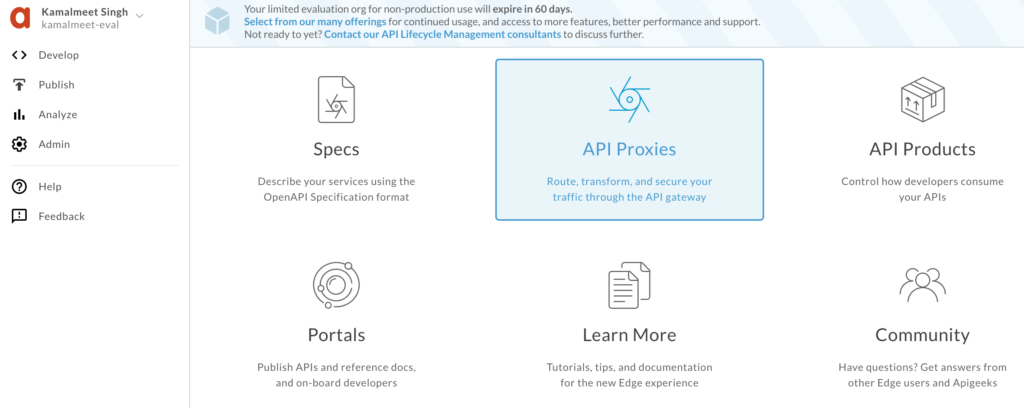
Getting started with Apigee is easy, go to https://apigee.com and create a free 60-day evaluation account for testing. Once logged in, choose the API proxies option to get selected.
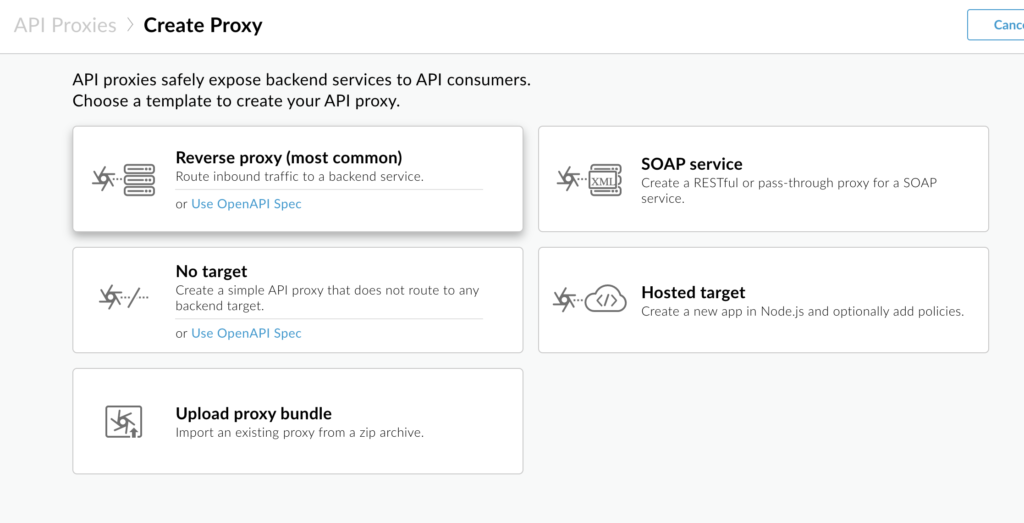
Create a new proxy, and we will select reverse proxy to start with.
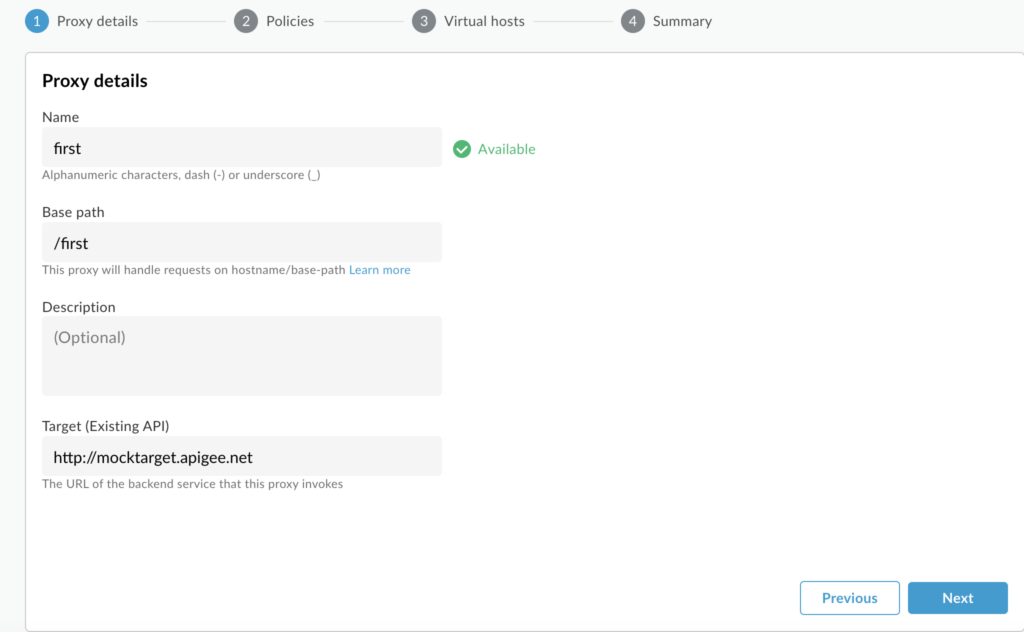
To start with, we will use the sample API provided by apigee- http://mocktarget.apigee.net (just prints string “Hello Guest”), and provide name, base path, and some description. You can see we have several other options like SOAP service, which is very useful if you have an existing SOAP service and want to expose it as REST services. Also, there is a No Target option which is helpful when we are creating Mock APIs to test our client applications. But as mentioned, for now, we are creating a reverse proxy for this example.
For the first iteration, we will not add any policy and leave all other options as default (no policy selected).
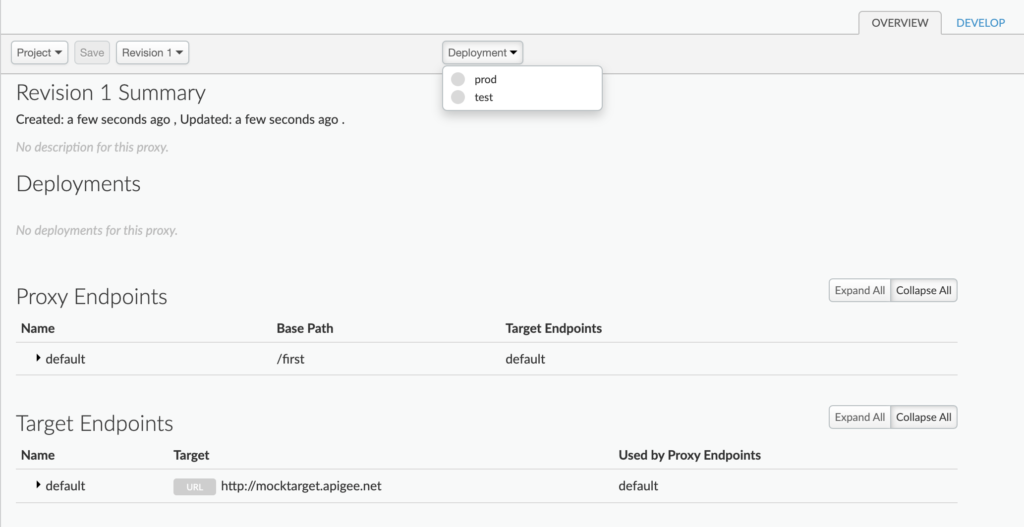
Once created, we will deploy the API to the test environment. For a free evaluation version, we are provided two environments only, test and prod.
After successful deployment, a proxy URL will be provided by apigee, something like https://kamalmeet-eval-test.apigee.net/first, which we can hit and get the output (Hello Guest). We can see that we are hitting proxy URL which in turn hits the actual URL, in this case, http://mocktarget.apigee.net/.
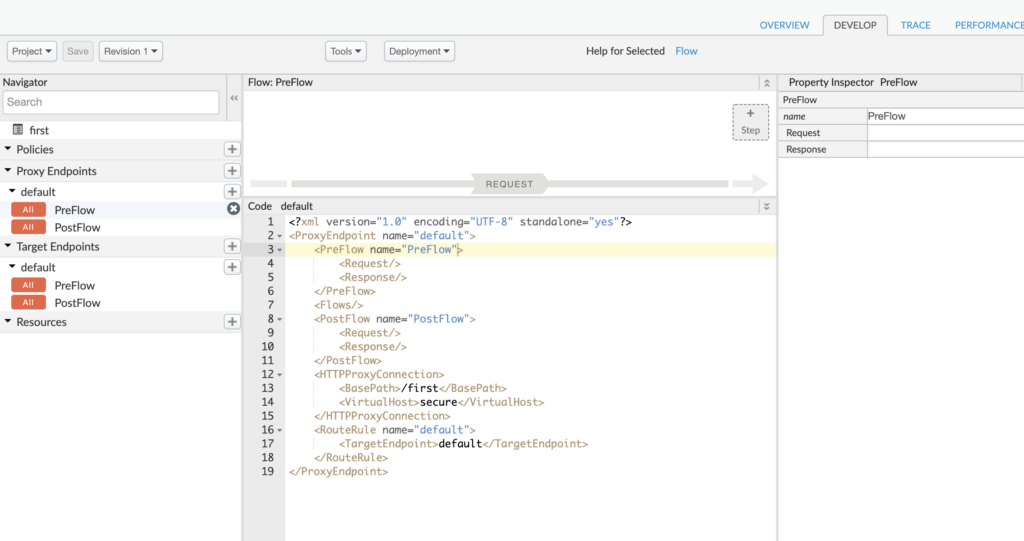
Go get an understanding of what is happening behind the scenes, we will look into the “Develop” tab.
We can see two sets of endpoint settings, a proxy endpoint, and a target endpoint. The proxy endpoint is the one exposed to the calling service. The target endpoint is the one that is communicating with the provider service.
Currently, we have not done much with the endpoints so we see very basic XML settings. On the proxy side, all we see is connection /first and the fact that we are exposing a secured URL. Similarly, on the target side, all we have is the target URL.
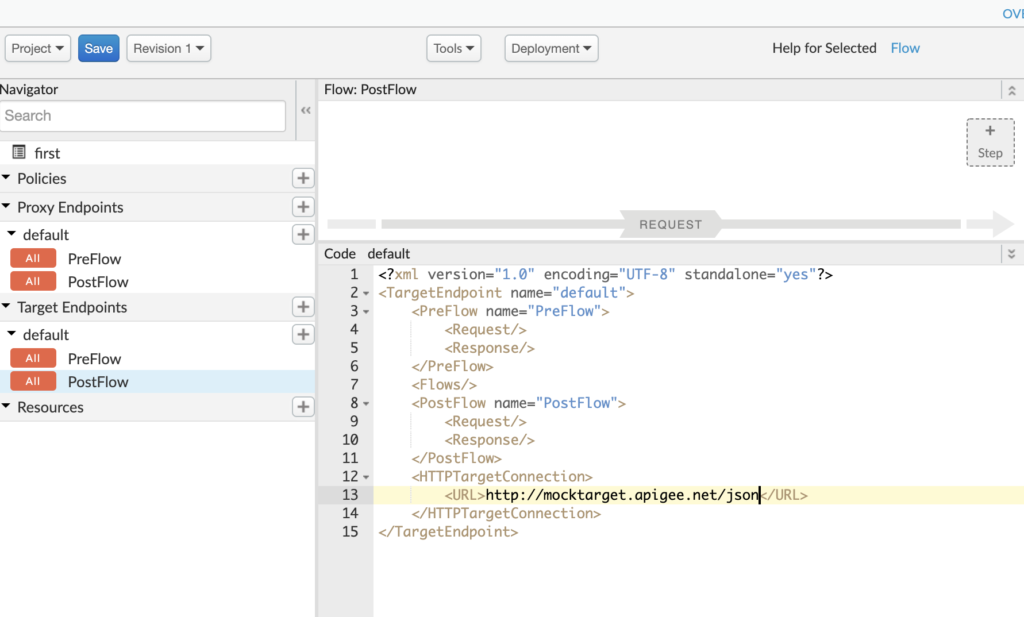
To make the API more meaningful, let’s modify the target endpoint to https://mocktarget.apigee.net/json, which returns a sample JSON like
We can update the same Proxy that we created earlier or create a new one. To update the existing one, just go to the develop tab and update the target endpoint URL.
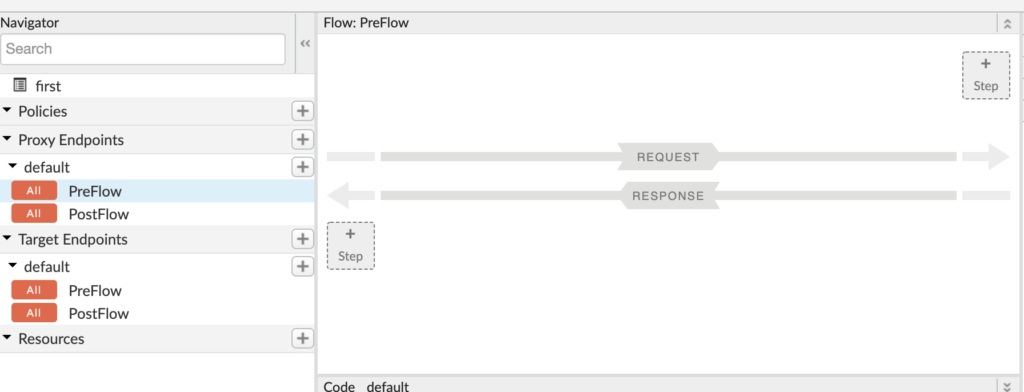
When you click on save, it will deploy automatically (else you can undeploy and deploy). Once done, you will see the existing proxy URL that we created now returns the JSON response https://kamalmeet-eval-test.apigee.net/first. So far we have not added any policy to our APIs. Well, that is easy, in the same develop tab, just above the XML definitions we see a flow diagram.
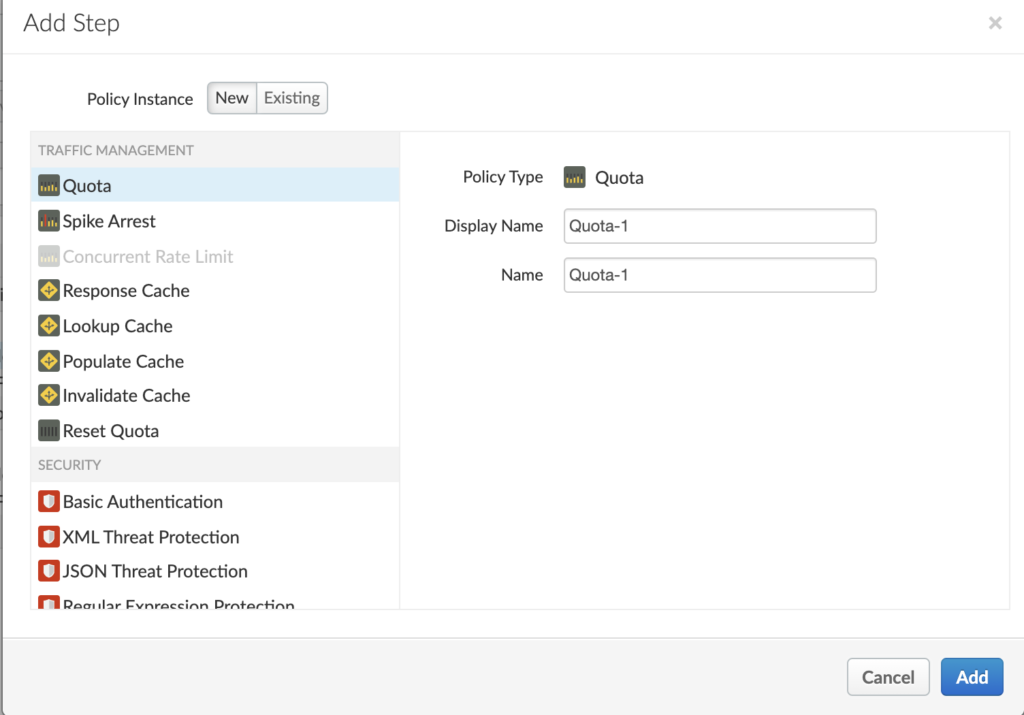
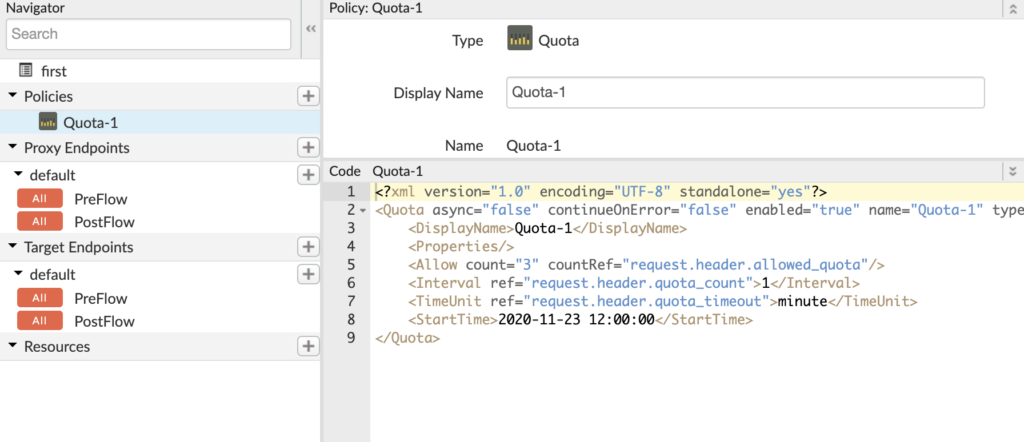
We can add a step to request flow or response flow. Let’s add a policy to request flow by clicking on the +Step button. To start, let’s add a quota policy.
By default, the quota policy gives settings for 2000 requests per month. For sake of this test, let’s modify it to 3 calls per minute.
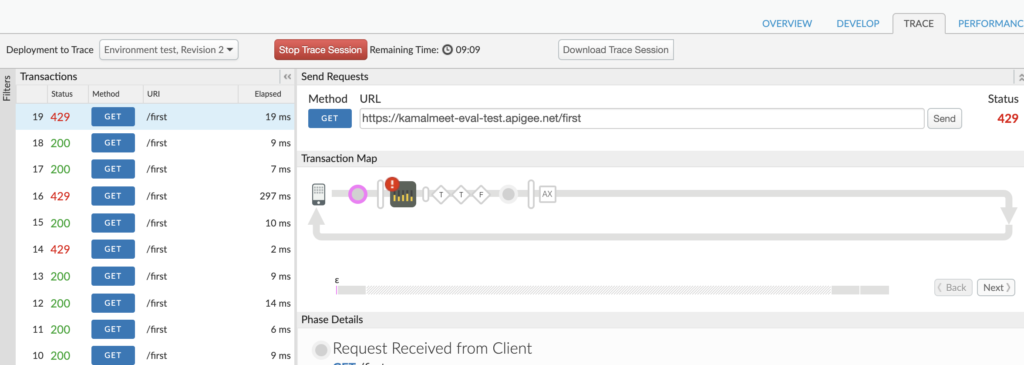
To test the quota implementation, we can go to the trace tab and hit the URL multiple times. We can see response code 429 (too many requests), caused by the quota limit.
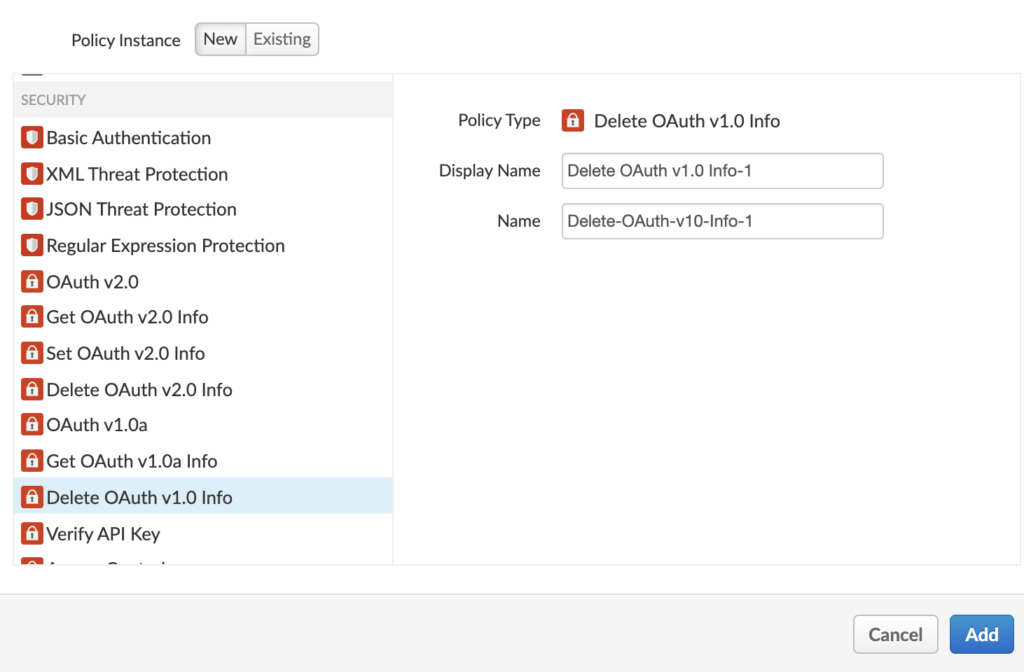
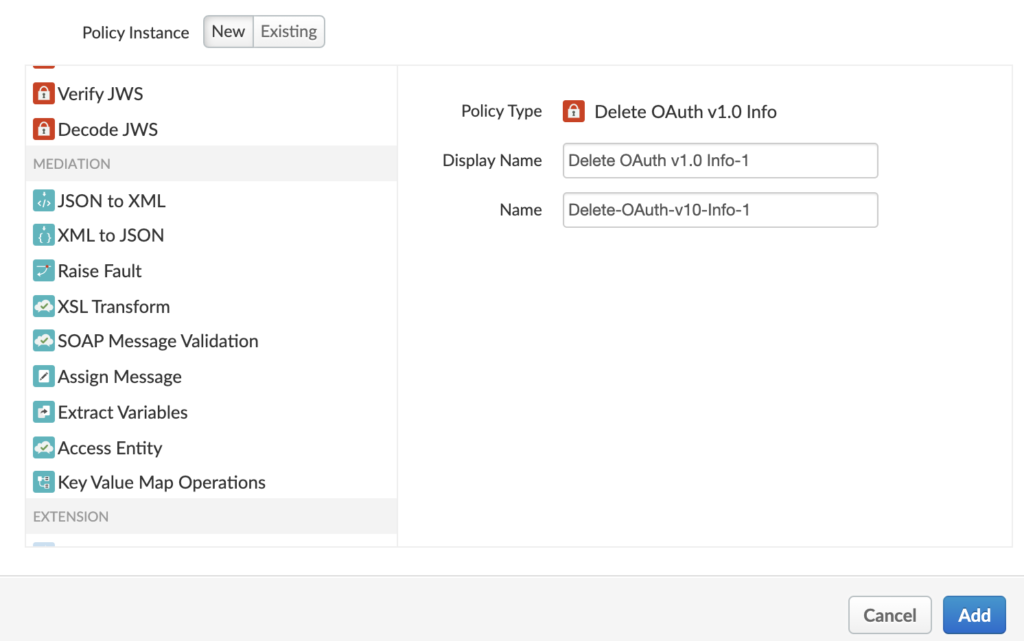
We have implemented the quota policy, which can be very useful to stop a bot attack on our API. Similarly, Apigee provides us with a set of policies categorized under traffic management, security, and mediation. For traffic management, we have a quota, spike arrest, caching, etc. For Security, we have policies like Basic Auth, JSON threat protection, XML threat protection, OAuth, and so on.
For mediation, we have policy likes, JSON to XML, XML to JSON, XSL transformation, etc.
In the example we created, we added a policy to the incoming request, similarly, we can add a policy to response, for example, if we apply JSON to XML policy to the response, we will start receiving XML response instead of JSON.
Often you need to make a decision how your services will accept the message payload from calling services or clients. The two popular ways to implement messaging between services is SOAP and REST.
SOAP or Simple Object Access Protocol relies on a very specific message format to pass on the information. It uses XML based messages, and a message usually contains an envelop, headers, body and fault part. It provides built in error handling, when a request has an error, response would give proper error details.
A discussion about SOAP is incomplete without referring to WSDL. Web Service Description Language is an XML based document which gives details regarding the WebService. How many services it provides, how to invoke the service, what kind of request and response is expected, and so on. WSDL is shared with calling or client services, which can use it to understand the provider service structure. Many languages have automated tools or libraries to generate client code automatically using the WSDL.
WSDL 1.1 Term
WSDL 2.0 Term
Description
Service
Service
Contains a set of system functions that have been exposed to the Web-based protocols.
Port
Endpoint
Defines the address or connection point to a Web service. It is typically represented by a simple HTTP URL string.
Binding
Binding
Specifies the interface and defines the SOAP binding style (RPC/Document) and transport (SOAP Protocol). The binding section also defines the operations.
PortType
Interface
Defines a Web service, the operations that can be performed, and the messages that are used to perform the operation.
Operation
Operation
Defines the SOAP actions and the way the message is encoded, for example, “literal.” An operation is like a method or function call in a traditional programming language.
Message
n/a
Typically, a message corresponds to an operation. The message contains the information needed to perform the operation. Each message is made up of one or more logical parts. Each part is associated with a message-typing attribute. The message name attribute provides a unique name among all messages. The part name attribute provides a unique name among all the parts of the enclosing message. Parts are a description of the logical content of a message. In RPC binding, a binding may reference the name of a part in order to specify binding-specific information about the part. A part may represent a parameter in the message; the bindings define the actual meaning of the part. Messages were removed in WSDL 2.0, in which XML schema types for defining bodies of inputs, outputs and faults are referred to simply and directly.
Types
Types
Describes the data. The XML Schema language (also known as XSD) is used (inline or referenced) for this purpose.
REST or Representational State Transfer is an architectural style rather than a protocol which lets one use HTTP verbs to communicate among services. It helps making the communication easier as there is no restriction in format of data being sent. Also it is often easier to implement and lightweight as no need for XML parsing on client and provider side.
HTTP method
Description
GET
Get a representation of the target resource’s state.
POST
Let the target resource process the representation enclosed in the request.
PUT
Set the target resource’s state to the state defined by the representation enclosed in the request.
Monitoring logs for an application is an important part of any deployment and support cycle. You want to keep a check on logs to understand what is happening with your application. But these logs are mostly GBs of raw data, that making sense out of this is not very easy. Thankfully there are many off the shelf tools available to help us out in this tedious task. I have already talked about ELK which is a popular tool for log analytics. In this post, we will talk about some of the other popular tools and get an idea of how these can help us.
Splunk is a tool to collect and analyze logs. Splunk basically has three core components, a forwarder which will forward data to Splunk server, An indexer which takes the data and indexes it for better search and finally Search head component which actually looks into the data and searches relevant information. An important aspect of Splunk is that it can easily scale horizontally with Splunk cluster, so you can manage GBs of data coming in the form of logs.
Graylog is another option for log monitoring. You can stream your logs to Greylog, which uses MongoDB and ElasticSearch behind the scenes to make sure you get fast and useful analysis.
Then there are specialized tools like SumoLogic for log analysis, which works on your log data and can provide additional analytics based on your logs. It can help you make sense of your logs as well as provide suggestions.
I have talked about how to use tools provided by Azure and AWS for monitoring the health of your applications and servers. But there will be times when you need something opensource to keep you independent of the underlying cloud service provider. Prometheus is one such tool that will help in these cases.
Prometheus is an open-source monitoring and alerting tool. It helps gather metrics in time series data format from various sources and monitor that. Written in Go language, the tool can be combined with Grafana or other consumers to capture and visualize data.
Image above shows the architecture for Prometheus. Following are the core components
Prometheus Server: The server collects metrics from applications and stores them locally. Data is collected at regular intervals and stored for processing.
PushGateway: There are cases when an endpoint cannot be exposed by the application due to the nature of its work, such as static jobs. The Push gateway captures the data, transforms that data into the Prometheus data format, and then pushes that data onto the Prometheus server.
Alert Manager: Based on collected data, rules can be configured to send alerts in the form of SMS, Email, etc.
Client Libraries: A set of client libraries is provided which can be added to application code for enabling monitoring endpoints.
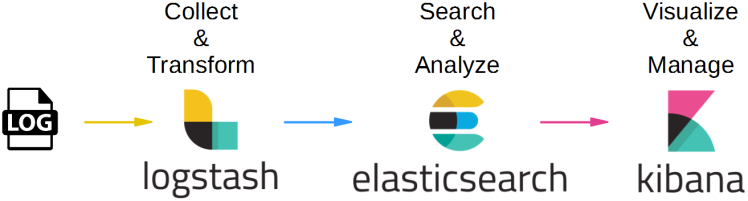
In the last three posts, I had talked about three popular off the shelf monitoring tools by cloud service providers, i.e. AWS CloudWatch, Azure Application Insights, and Azure Monitor. A discussion about monitoring cloud-native applications and microservices is incomplete without discussing ELK stack. ELK stack provides end to end functionality from capturing logs, indexing them in a useful manner, and finally visualizing them in a form that makes sense. Three core components that make the ELK stack are Elastic Search, Logstash, and Kibana.
As the image above shows, three tools forming ELK stack work together, where Logstash is responsible for the collection and transformation of logs, ElasticSearch indexes and makes logs searchable, and finally Kiabana helps them visualize in forms of reports which are easy o make sense of.
Let’s take a look at these three components.
ElasticSearch: is a popular search engine implementer. It indexes data and helps in implementing quick searches. It is based on Apache Lucene and provides REST APIs for accessing data. It is highly scalable and reliable, implemented on the No-SQL database.
Logstash: provides connectors for various input sources and platforms, helping in the collection of logs data from different sources. It can collect, parse, and manage a variety of structured and unstructured data.
Kibana: is basically a visualization tool, provides various user-friendly visual options for reporting like graphs, bars, tables, etc. One can create and share dashboards for an easy understanding of data in form of visual reports.
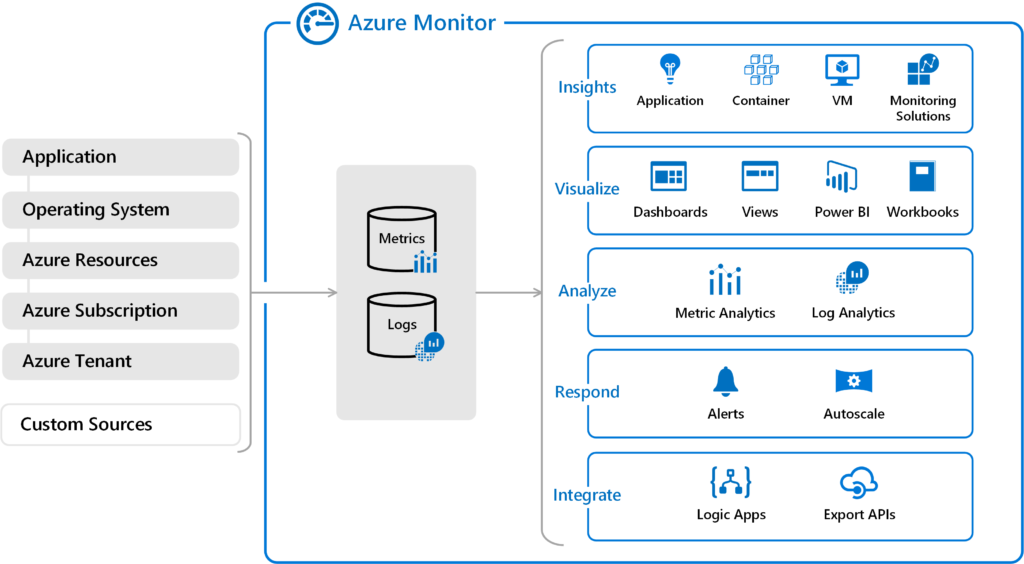
Azure Monitor is a tool, which acts as an umbrella for services that help us gather telemetry data and analyze it. Azure Monitor Captures data in form of Logs and Metrics. Logs contain time-stamped information about changes made to resources. Logs data is mostly in text form. Whereas Metrics are numerical values that describe some aspect of a system at a point in time.
The image above shows how Azure monitor gathers data in form of Logs and Metrics from Applications and other Azure resources. Once data is gathered, Monitor can be used to view and analyze data in the form of tables and graphs. In addition, one can set up an automated response in the form of Alerts or passing the information to Logic Apps or Custom APIs.
You can capture the following data for Azure monitor
Application data: Data that relates to your custom application code. Operating system data: Data from the Windows or Linux virtual machines that host your application. Azure resource data: Data that relates to the operations of an Azure resource, such as a web app or a load balancer. Azure subscription data: Data that relates to your subscription. It includes data about Azure health and availability. Azure tenant data: Data about your Azure organization-level services, such as Azure Active Directory.
Once your application is deployed in a production environment, you want to make sure everything is working fine with it. You would like to analyze how many exceptions and errors are being thrown, how many requests are being handled, how many requests are being made, what is memory and CPU usage, and so on. In Azure, you can do all this by using the Application Insights tool.
You can see in the above image that your application components will publish the data to Application Insights service, from where you can create alerts, reports, or trigger other actions based on your need.
Once your application is deployed to production, monitoring is the only friend that can help you avoid embarrassing situations like a service not responding or an application is running very slow. You would like to make sure that monitoring and alerting systems are in place so that before you start hearing complaints from your end users, you can know about the problem and fix it. You would also like to make sure automated systems are in place to handle such issues.
Amazon CloudWatch is a service provided by AWS which can help us add monitoring for AWS resources.
Let’s try to understand the above design. AWS services publish data to cloud watch in the form of metrics. Metrics here contain time-ordered data for various aspects, like CPU usage. Cloud watch processes the data and is capable of showing that in the form of graphs and bars. One can also set alarms on certain events like CPU usage goes beyond 75%. Based on alarm action can be taken like sending an email notification to admins or autoscale the application by adding an additional server to reduce CPU usage. One can also publish additional application data to CloudWatch for monitoring.
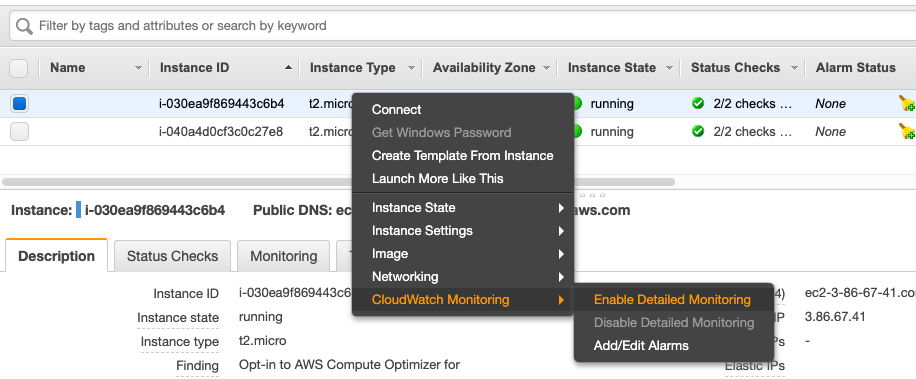
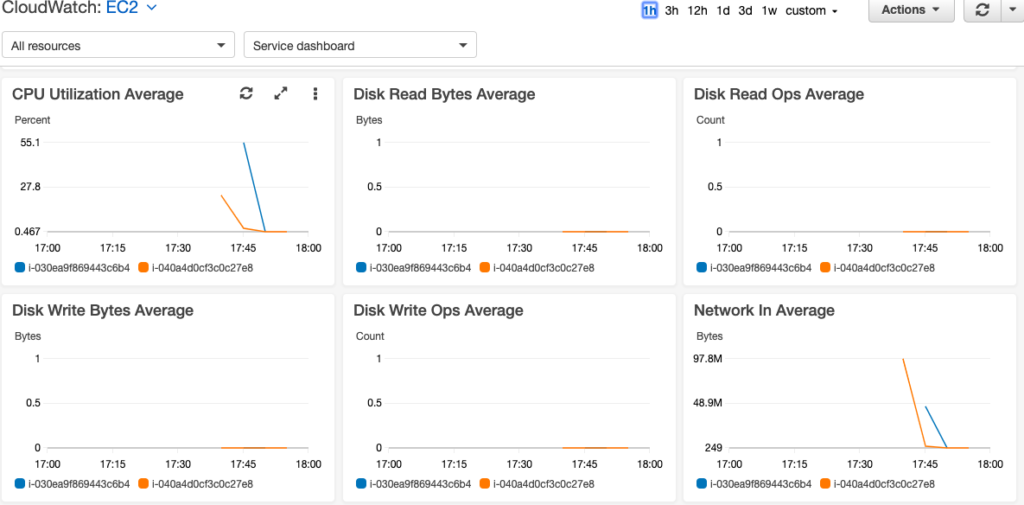
Let’s take a look at how we can create metrics and alerts for EC2 instance. Basic CloudWatch is by default enabled for EC2. You can enable detailed monitoring which will register events every minute, but it is a paid option.
For this example, I will move ahead with basic default monitoring. As I mentioned that default monitoring is enabled by default, so once you go to CloudWatch, select EC2 resources and you will see some default metrics already in place.
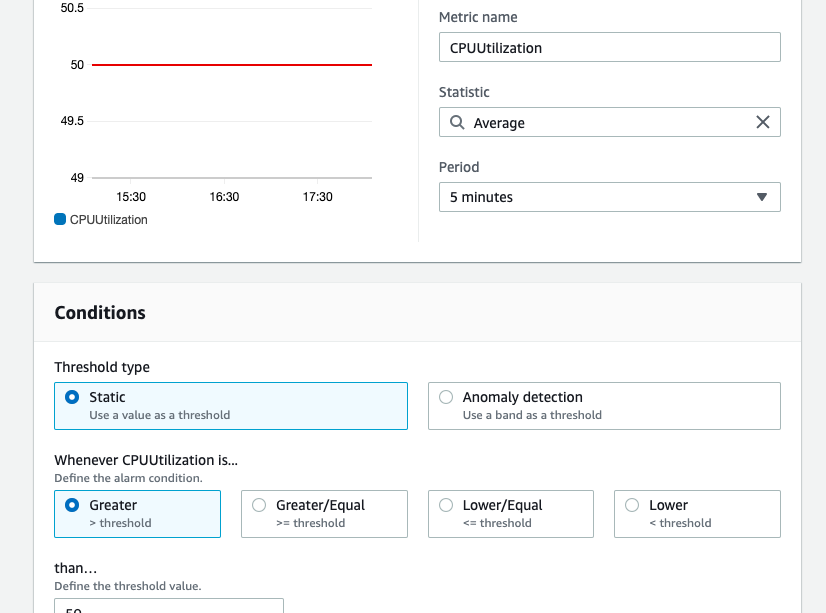
As a next step, we will add Alarms for the instances. You can set up alarms at an individual level, scale group level for autoscale, type of instance, and so on. For the sake of this example, I am choosing a metric of average CPU utilization for all my EC2 instances.
So the alert I am setting says that whenever average CPU utilization for all my instance goes beyond 50% an alarm should be raised. As a result of alarm, I can make the CloudWatch send a message to SNS or Simple Notification Service Queue, from which I can read in some application or serverless function and configure to send email or SMS notifications. One can also set auto-scale options like adding or removing servers or simply restarting an EC2 instance based on the alarm.
Before the cloud era, you were never sure how much hardware power is sufficient for you. You did not want to over-provision and the infrastructure is unused, at the same time you did not want your customer to face issues just because you did not have sufficient infrastructure. Cloud has changed this for us and made scalability possible by providing services out of the box that helps us create a scalable system.
Cloud helps, but it onus of the development team to make sure we design our application in a manner that is scalable and understand cloud capabilities to use them effectively in order to create a scalable and cost-effective system. For example, for some service it might make sense to use a serverless function that is auto-scalable rather than code deployed on a Virtual Machine. Similarly, a NoSQL based database might be more scalable than a SQL database.
Let’s take at three core aspects which we need to consider scalability.
Compute: The most obvious compute option you have on the cloud is a virtual machine. one can scale virtual machines, by setting up autoscaling with rules like if average CPU usage goes beyond a certain percentage. There are compute options provided by cloud service providers like serverless functions, batch executions, and off the shelf application environments which are auto-scalable. One needs to carefully observe all the services available and take a final call that is most suitable for the application.
Additionally, with the popularity of container-based implementation, most of the cloud service providers have offerings for docker and Kubernetes based implementations. It is worth exploring if that can help your design in the longer run,
Database: After the compute resources, one needs to understand the database needs of the application and how to scale that. We know that a NoSQL database is more scalable than a SQL based database as it can easily be scattered across the storage. Even if one needs to go for the SQL database, there are techniques like sharding which can help us make out database scalable. Again one needs to understand offering from the cloud service provider being used and choose the best options available for database, backup, and replication.
Storage: Most of the cloud service providers have off the shelf storage services like Amazon S3 and Azure storage. Additionally, there are various options which will provide different cost benefits based on kind of usage, for example, one can choose cheaper storage options where data is not in use frequently. Also as these storage options have better backup, encryption, and restore options, one needs to make sure what should be store on a VM disk vs what can be stored in external storage.